
在数据分析和处理中,经常需要按照月份对时间序列数据进行分组和聚合。今天以高管违规数据为例, 想根据这份数据绘制月度高管违规量趋势,需要按照月份对数据进行分组,可以使用resample或groupby。本文知识点
- resample实现
- groupby实现
- resample和groupby运算结果是什么数据类型
一、resample实现步骤
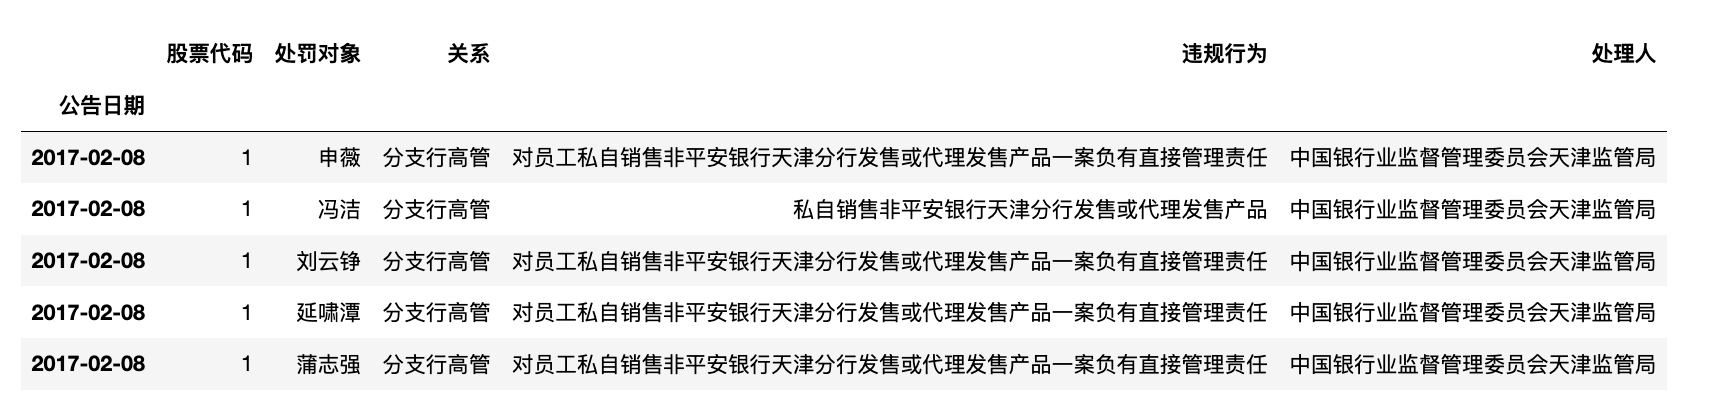
- 导入xlsx数据 (点击跳转获取数据)
- 使用set_index函数将’公告日期’列设置为索引,以便能够使用时间序列的功能。
- 使用resample函数并指定频率为’M'(表示按照月份)来对时间序列数据进行分组。使用了size函数获取每组的记录数
- 打印了分组结果df_resampled,其中每一行代表一个月份的总和。
import pandas as pd

df = pd.read_excel('上市公司高管违规-原始数据.xlsx')

df['公告日期'] = pd.to_datetime(df['公告日期'])
df.set_index('公告日期', inplace=True)
df.head()
# 将'date'列设置为索引
#df.set_index('公告日期', inplace=True)

# 按月份对时间序列数据进行分组
df_resampled = df.resample('M').size()
#df_resampled = df.resample('30D').size()

# 打印分组结果
print(df_resampled)
Run
    公告日期
    1997-01-31      1
    1997-02-28      0
    1997-03-31      0
    1997-04-30      0
    1997-05-31      0
                 ...
    2022-08-31    453
    2022-09-30    479
    2022-10-31    216
    2022-11-30    525
    2022-12-31    343
    Freq: M, Length: 312, dtype: int64
import matplotlib.pyplot as plt
import matplotlib
import matplotlib_inline
matplotlib_inline.backend_inline.set_matplotlib_formats('png', 'svg')
import scienceplots
import platform
import numpy as np


plt.style.use(['science', 'no-latex', 'cjk-sc-font'])
system = platform.system()  # 获取操作系统类型

if system == 'Windows':
    font = {'family': 'SimHei'}
elif system == 'Darwin':
    font = {'family': 'Arial Unicode MS'}
else:
    font = {'family': 'sans-serif'}
matplotlib.rc('font', **font)  # 设置全局字体


plt.figure(figsize=(10, 5))
plt.xlabel('日期')
plt.ylabel('月度违规量')
plt.title('月度上市公司高管违规量(1997-2022)')
df_resampled.plot()

二、groupby实现步骤
- 导入xlsx数据
- 使用set_index函数将’公告日期’列设置为索引,以便能够使用时间序列的功能。
- 使用groupby函数并指定频率为’M'(表示按照月份)来对时间序列数据进行分组。使用了size函数获取每组的记录数
- 打印了分组结果df_resampled,其中每一行代表一个月份的总和。
import pandas as pd

df2 = pd.read_excel('上市公司高管违规-原始数据.xlsx')

df2['公告日期'] = pd.to_datetime(df2['公告日期'])

# 将'date'列设置为索引
df2.set_index('公告日期', inplace=True)

# 按月份对时间序列数据进行分组
df2_grouped = df2.groupby(pd.Grouper(freq='M')).size()

# 打印分组结果
print(df2_grouped)
Run
    公告日期
    1997-01-31      1
    1997-02-28      0
    1997-03-31      0
    1997-04-30      0
    1997-05-31      0
                 ...
    2022-08-31    453
    2022-09-30    479
    2022-10-31    216
    2022-11-30    525
    2022-12-31    343
    Freq: M, Length: 312, dtype: int64
import matplotlib.pyplot as plt
import matplotlib
import matplotlib_inline
matplotlib_inline.backend_inline.set_matplotlib_formats('png', 'svg')
import scienceplots
import platform
import numpy as np


plt.style.use(['science', 'no-latex', 'cjk-sc-font'])
system = platform.system()  # 获取操作系统类型

if system == 'Windows':
    font = {'family': 'SimHei'}
elif system == 'Darwin':
    font = {'family': 'Arial Unicode MS'}
else:
    font = {'family': 'sans-serif'}
matplotlib.rc('font', **font)  # 设置全局字体


plt.figure(figsize=(10, 5))
plt.xlabel('日期')
plt.ylabel('月度违规量')
plt.title('月度上市公司高管违规量(1997-2022)')
df2_grouped.plot()
三、深入理解
df2.resample(‘M’)或df2.groupby(pd.Grouper(freq=‘M’)) 返回的结果是什么类型的数据,有什么特点。
df2.resample('M')
Run
<pandas.core.resample.DatetimeIndexResampler object at 0x7fece05fb160>
df2.groupby(pd.Grouper(freq='M'))
Run
<pandas.core.groupby.generic.DataFrameGroupBy object at 0x7fed31571df0>
只要遇到 < object at 0x7fece05fb160>,不知道这内部是什么。可以使用for循环拆解这个黑盒子
for x in df2.resample('M'):
    print(type(x), len(x))
Run
<class 'tuple'> 2
<class 'tuple'> 2
<class 'tuple'> 2
<class 'tuple'> 2
<class 'tuple'> 2
<class 'tuple'> 2
......
for x in df2.groupby(pd.Grouper(freq='M')):
    print(type(x), len(x))
Run
<class 'tuple'> 2
<class 'tuple'> 2
<class 'tuple'> 2
<class 'tuple'> 2
<class 'tuple'> 2
<class 'tuple'> 2
......
经过检查发现df2.resample(‘M’)或df2.groupby(pd.Grouper(freq=‘M’)) 内部都是由tuple组成的,而每个tuple又由「日期」和对应的「dataframe」组成。
for x in df2.resample('M'):
    print(type(x[0]), type(x[1]))
Run
<class 'pandas._libs.tslibs.timestamps.Timestamp'> <class 'pandas.core.frame.DataFrame'>
<class 'pandas._libs.tslibs.timestamps.Timestamp'> <class 'pandas.core.frame.DataFrame'>
<class 'pandas._libs.tslibs.timestamps.Timestamp'> <class 'pandas.core.frame.DataFrame'>
<class 'pandas._libs.tslibs.timestamps.Timestamp'> <class 'pandas.core.frame.DataFrame'>
<class 'pandas._libs.tslibs.timestamps.Timestamp'> <class 'pandas.core.frame.DataFrame'>
<class 'pandas._libs.tslibs.timestamps.Timestamp'> <class 'pandas.core.frame.DataFrame'>
......