一、任务
想绘制下图, 要求中文正常显示
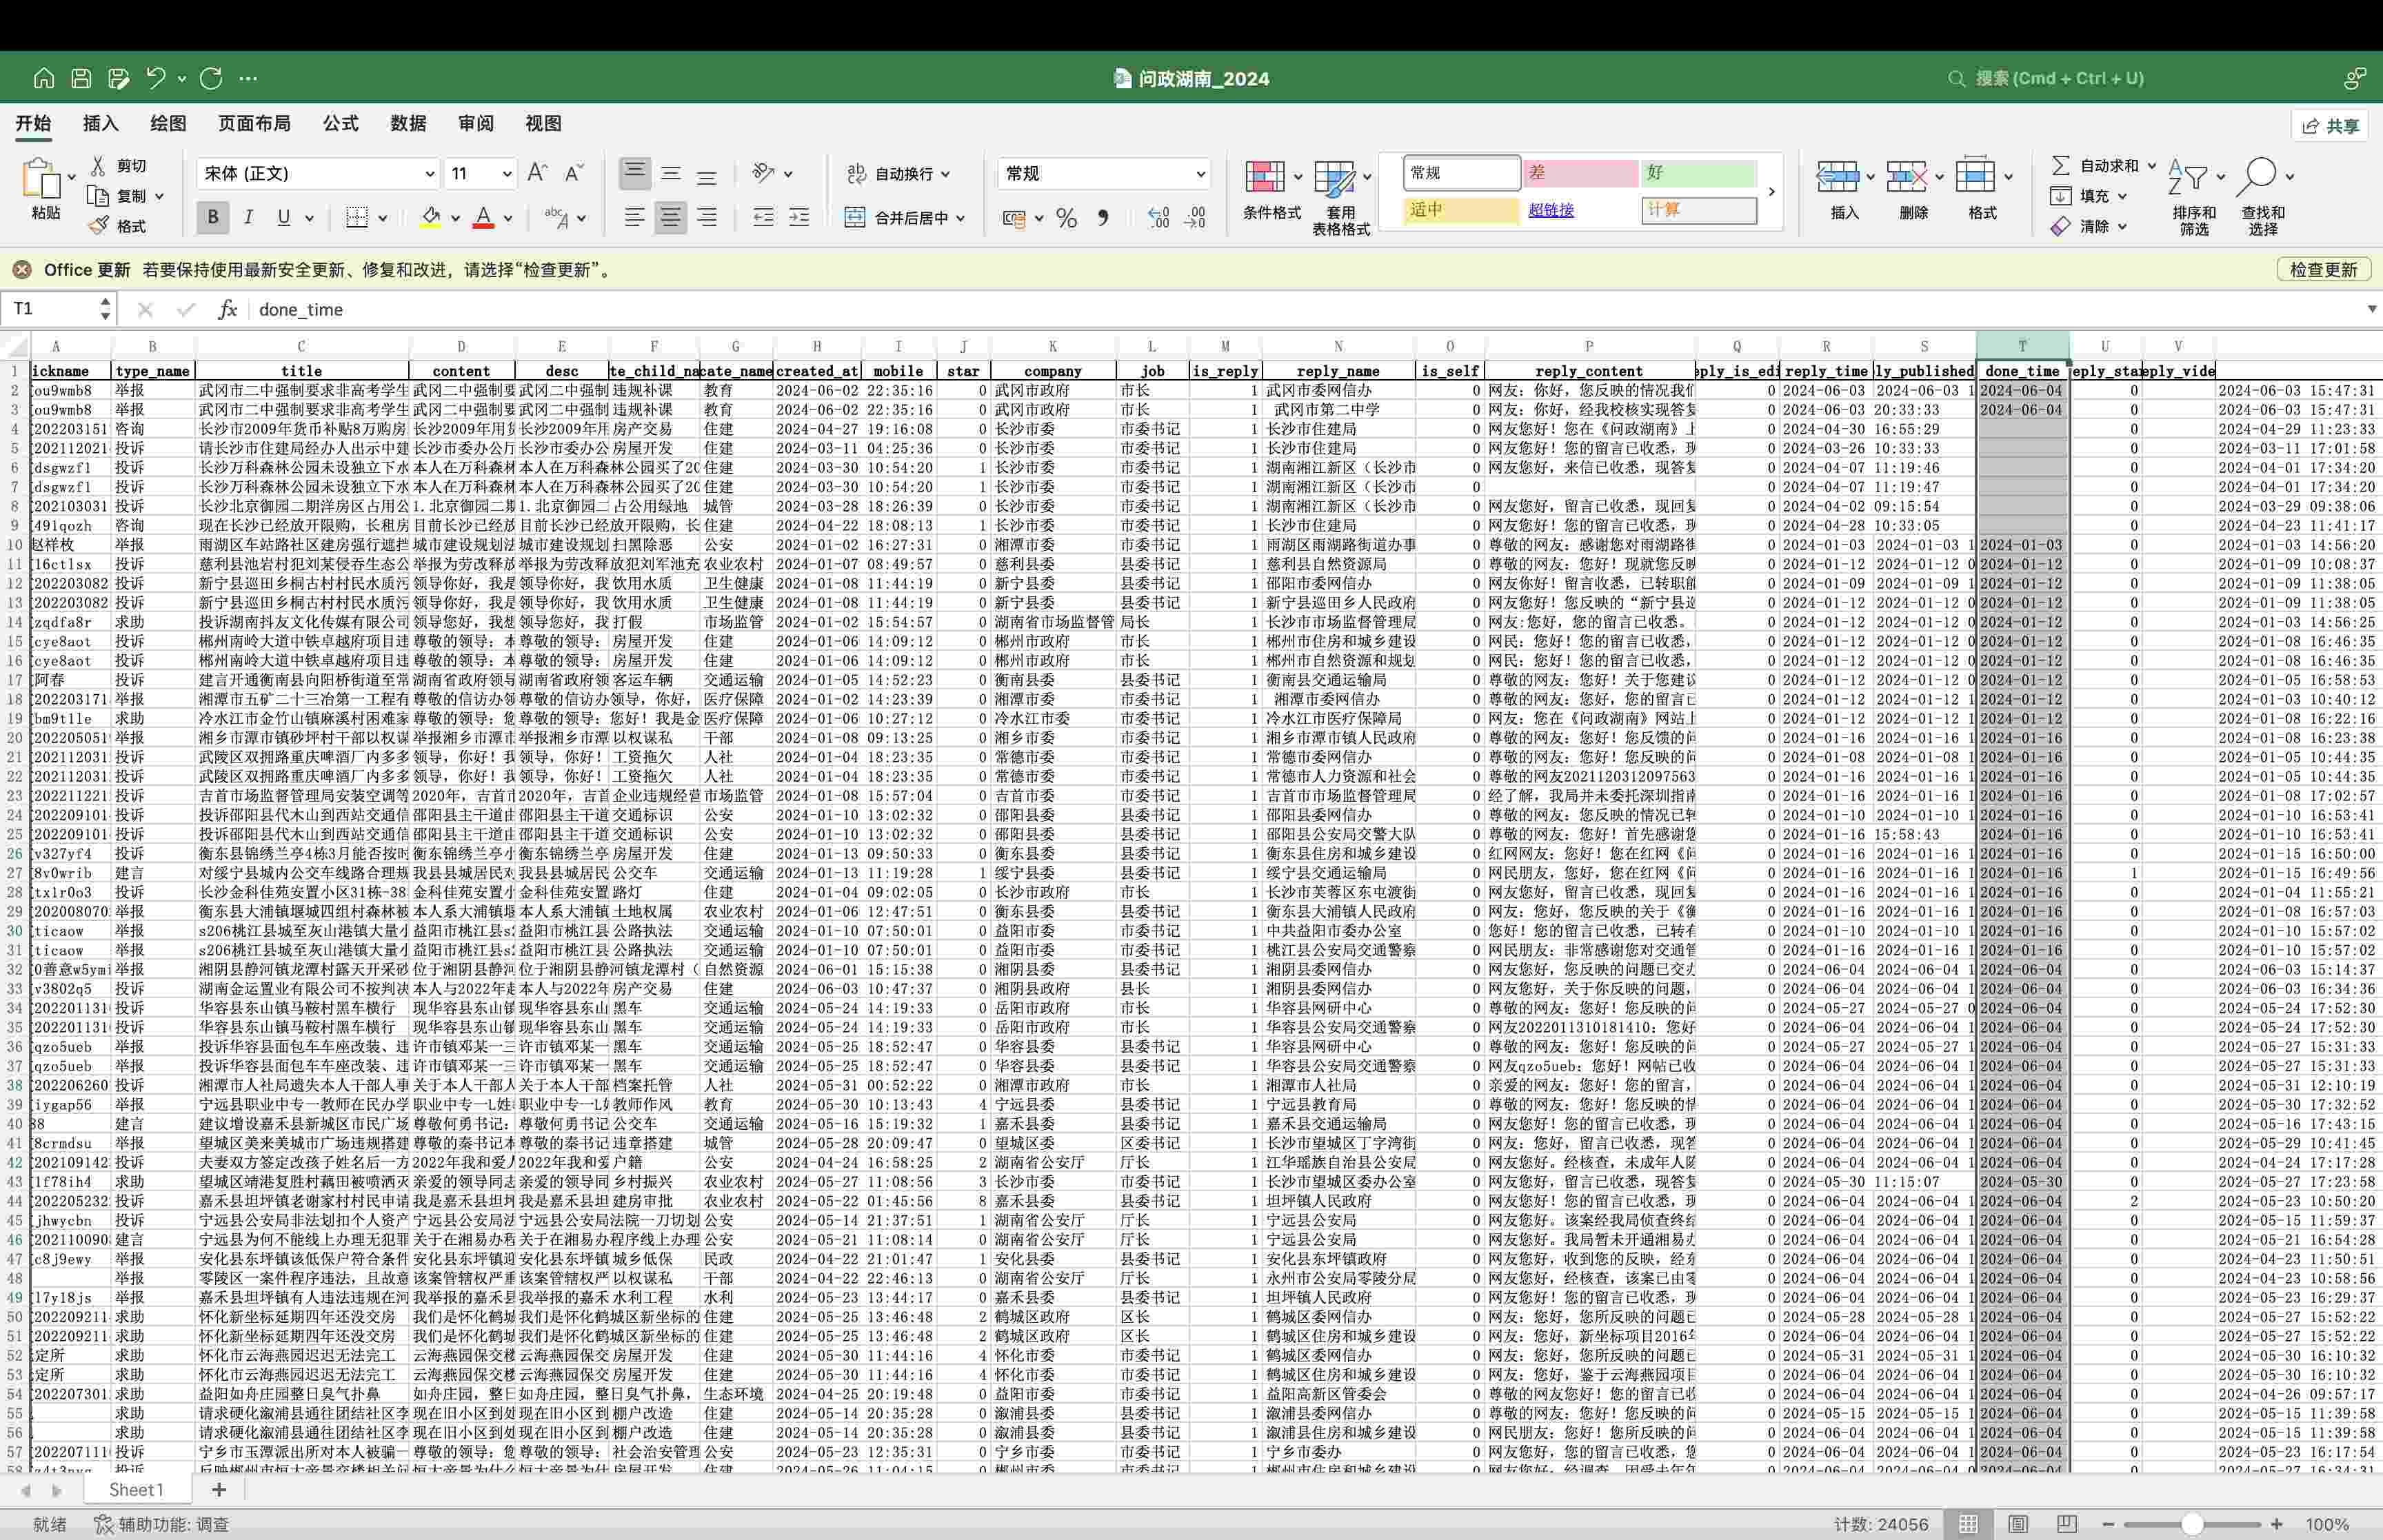
二、实验数据

实验数据整理自 数据集 | 30w条「问政湖南」留言&回复数据(2010-2024)
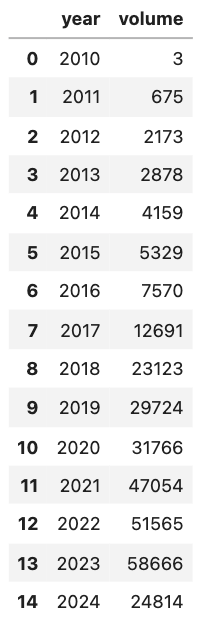
import pandas as pd

years = [2010, 2011, 2012, 2013, 2014, 2015, 2016, 2017
         ,
         2018, 2019, 2020, 2021, 2022, 2023, 2024]
volumes = [3, 675, 2173, 2878, 4159, 5329, 7570, 12691,
           23123, 29724, 31766, 47054, 51565, 58666, 24814]

data = pd.DataFrame({'year': years,
                    'volume': volumes})

data
三、失败的可视化
使用matplotlib绘制
import matplotlib.pyplot as plt
plt.figure(figsize=(10, 6))
plt.scatter(data.year, data.volume)
plt.plot(data.year, data.volume)
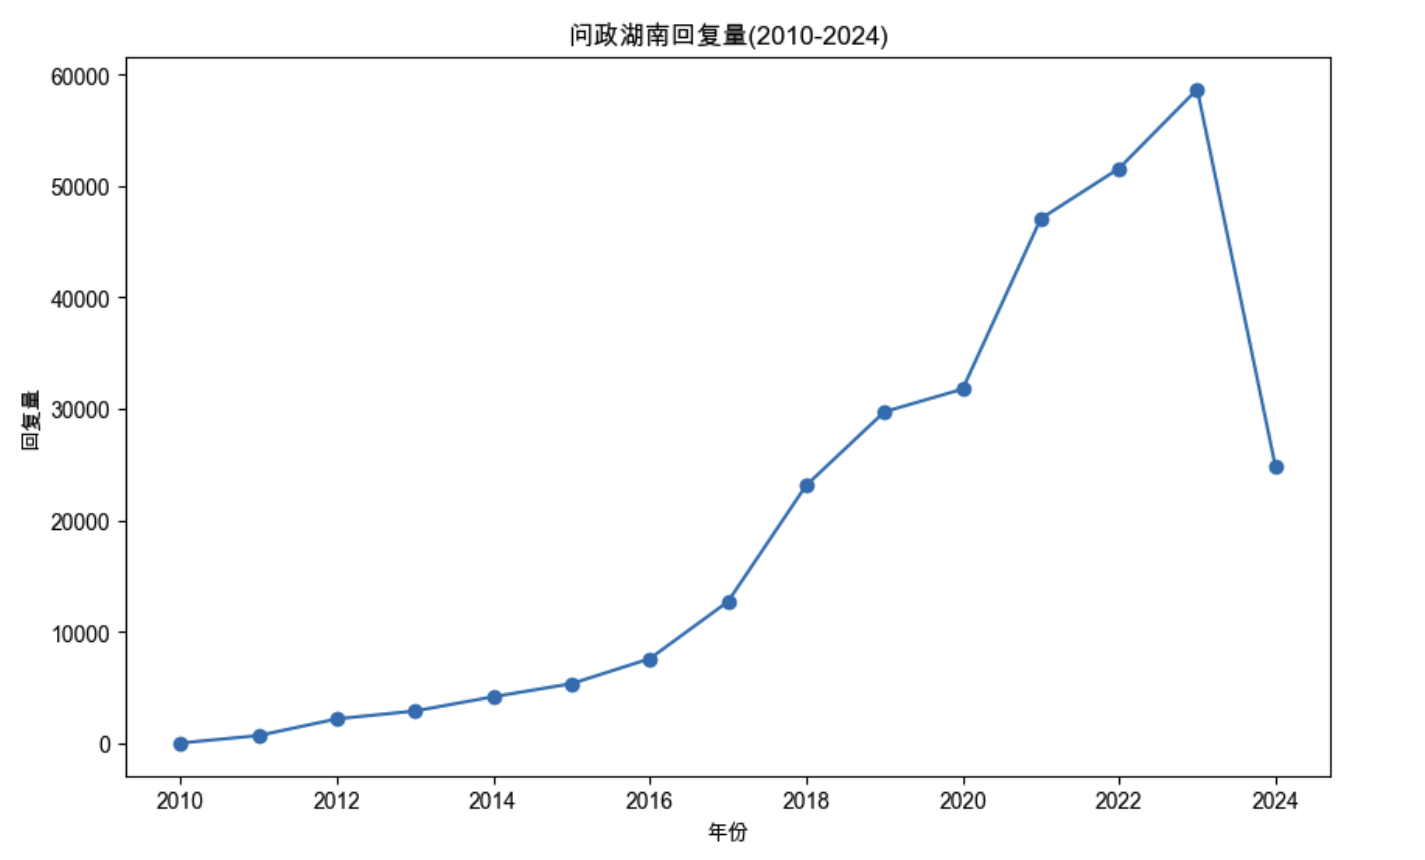
plt.xlabel('年份')
plt.ylabel('回复量')
plt.title('问政湖南回复量(2010-2024)')
plt.show()
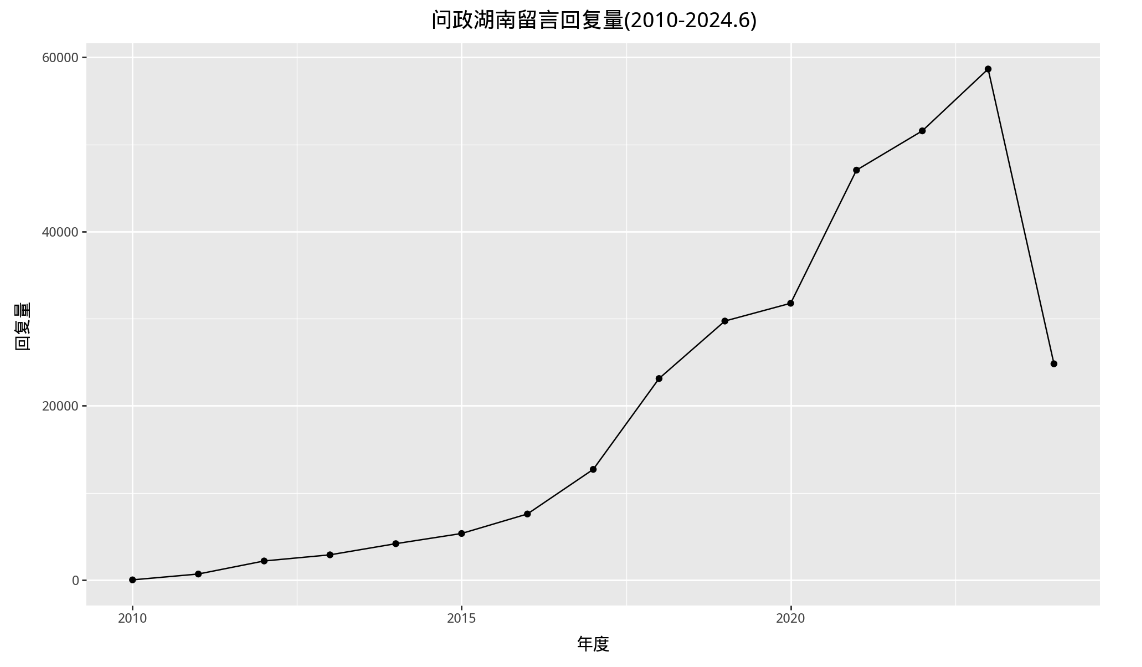
使用plotnine绘制
from plotnine import *
(
ggplot(data, aes(x='year', y='volume'))
+geom_point()
+geom_line()
+theme(figure_size=(10, 6))
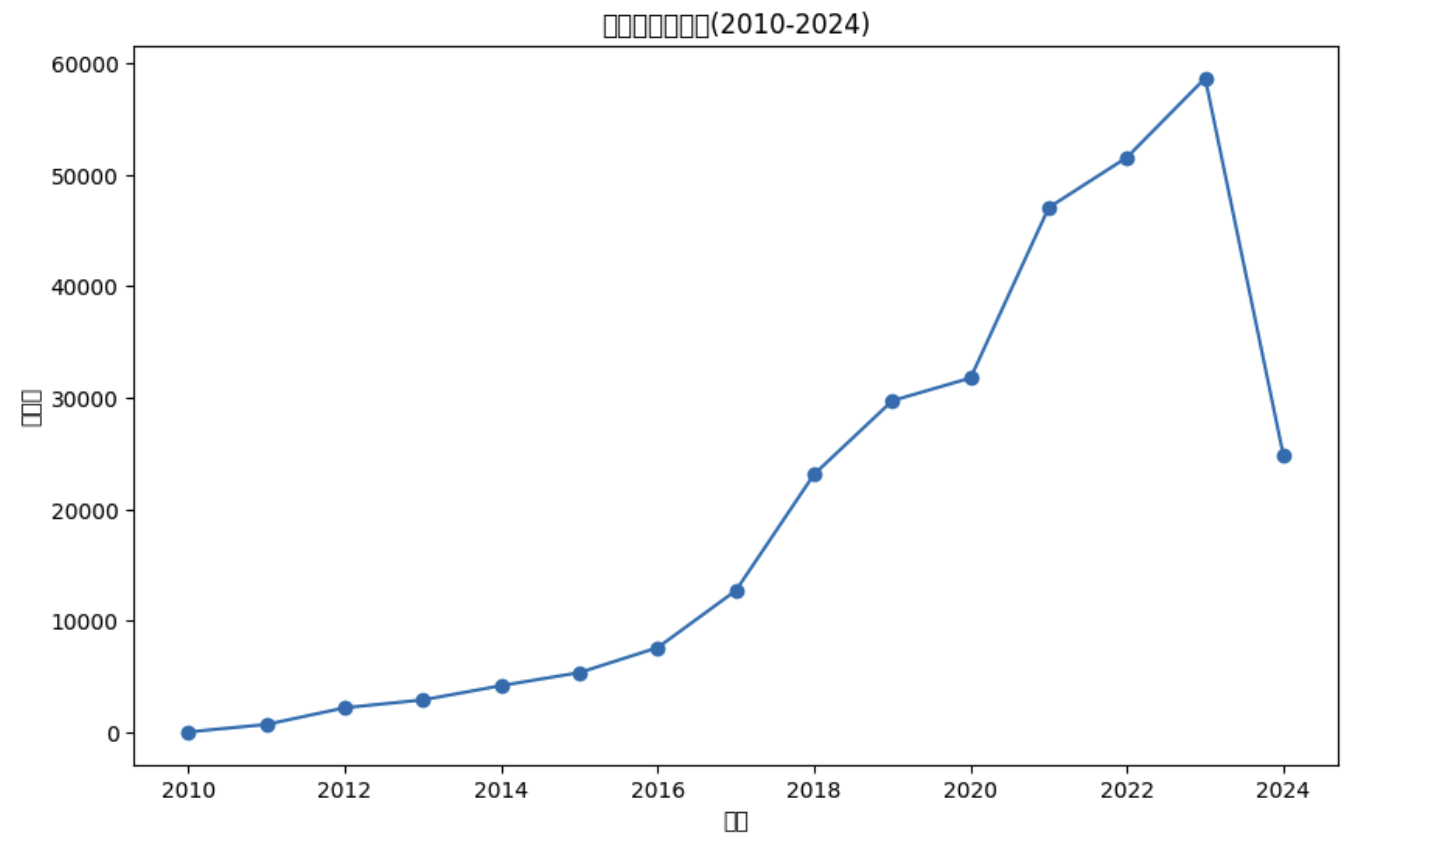
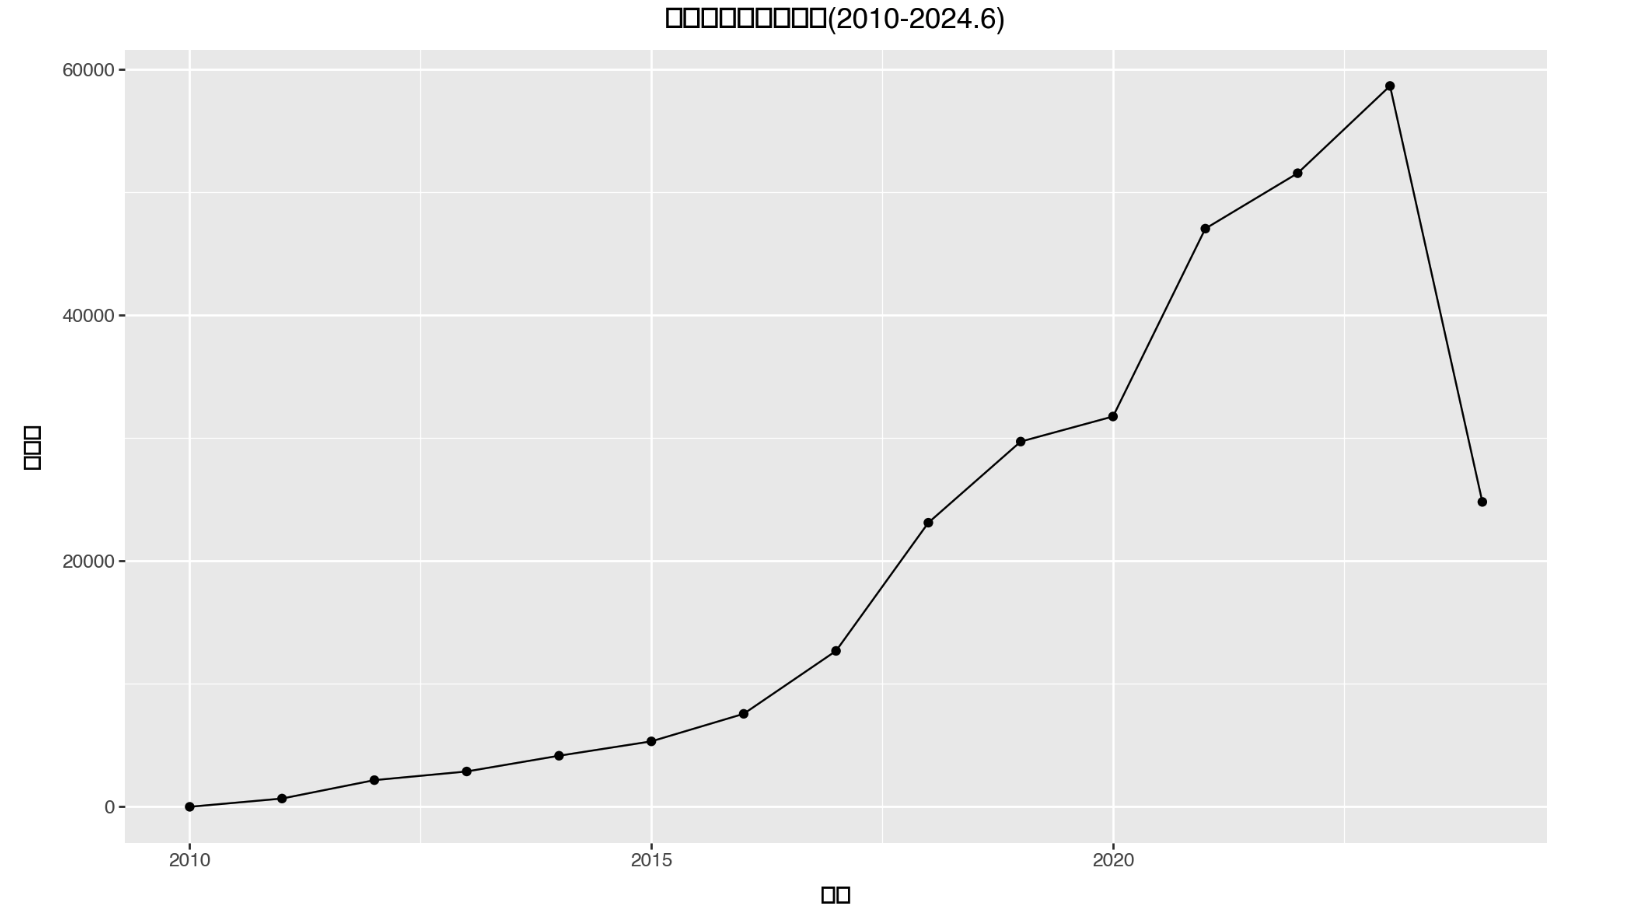
+labs(title='问政湖南留言回复量(2010-2024.6)',
x = '年度',
y = '回复量')
)
四、使用系统内置字体
import platform
import matplotlib.pyplot as plt
import matplotlib
system = platform.system() # 获取操作系统类型
if system == 'Windows':
font = {'family': 'SimHei'}
elif system == 'Darwin':
font = {'family': 'Arial Unicode MS'}
else:
font = {'family': 'sans-serif'}
matplotlib.rc('font', **font) # 设置全局字体
plt.figure(figsize=(10, 6))
plt.scatter(data.year, data.volume)
plt.plot(data.year, data.volume)
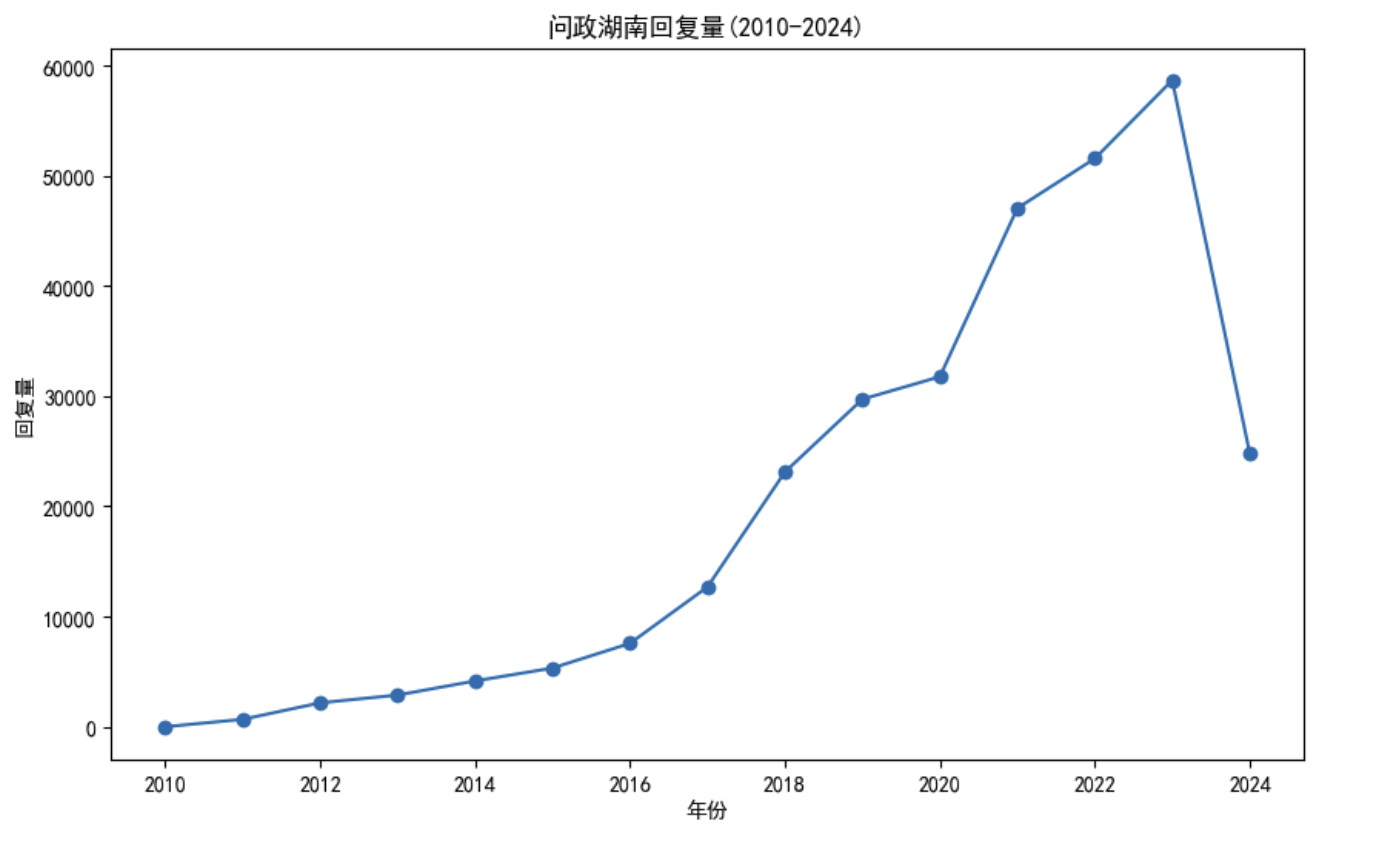
plt.xlabel('年份')
plt.ylabel('回复量')
plt.title('问政湖南回复量(2010-2024)')
plt.show()
五、使用chineseize-matplotlib
安装
pip install chineseize-matplotlib
import platform
import matplotlib.pyplot as plt
import matplotlib
import chineseize_matplotlib

plt.figure(figsize=(10, 6))
plt.scatter(data.year, data.volume)
plt.plot(data.year, data.volume)
plt.xlabel('年份')
plt.ylabel('回复量')
plt.title('问政湖南回复量(2010-2024)')
plt.show()
六、使用外源ttf字体文件
本文实验字体 文泉驿微米黑.ttf 下载链接
from plotnine import *
import matplotlib.pyplot as plt
from matplotlib.font_manager import FontProperties

#文泉驿微米黑.ttf位于代码同文件夹
font_prop = FontProperties(fname='文泉驿微米黑.ttf')

(
    ggplot(data,  aes(x='year', y='volume'))
    +geom_point()
    +geom_line()
    +theme(figure_size=(10, 6),
           text = element_text(family = font_prop.get_name()),
           plot_title = element_text(family = font_prop.get_name(), size=14)
          )
    +labs(title='问政湖南留言回复量(2010-2024.6)',
          x = '年度',
          y = '回复量')
)
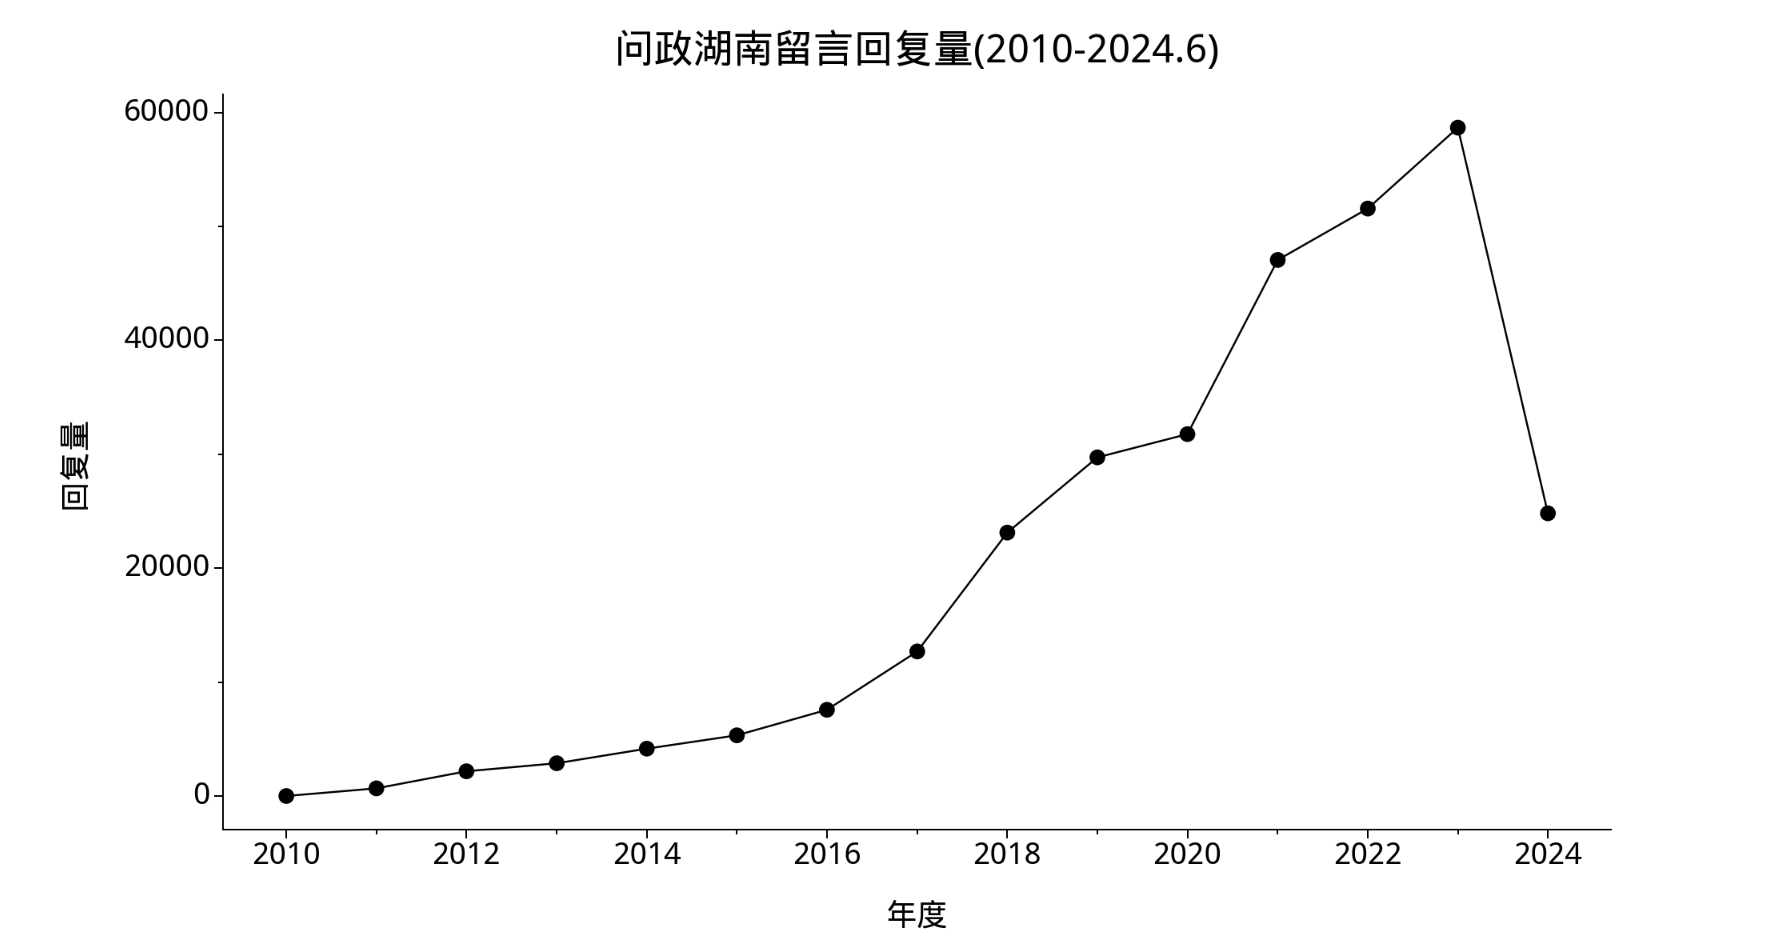
更美观一些
from plotnine import *
import matplotlib.pyplot as plt
from matplotlib.font_manager import FontProperties
##需要先安装mizani、plotnine_prism库
from plotnine_prism import *
from mizani.breaks import date_breaks
from mizani.formatters import date_format


#文泉驿微米黑.ttf位于代码同文件夹
font_prop = FontProperties(fname='文泉驿微米黑.ttf')

data['year'] = pd.to_datetime(data['year'])

(
    ggplot(data,  aes(x='year', y='volume'))
    +geom_point(size=3)
    +geom_line()
    +scale_x_datetime(breaks=date_breaks("2 years"), labels=date_format("%Y"))
    +labs(title='问政湖南留言回复量(2010-2024.6)',
          x = '年度',
          y = '回复量')
    +theme_prism(base_family=font_prop.get_name())
    +theme(figure_size=(10, 6),
           text = element_text(family = font_prop.get_name(), size=14),
           plot_title = element_text(family = font_prop.get_name(), size=18)
          )

)