问询函,是指上海证券交易所和深圳证券交易所在审核上市公司相关公告过程中如果发现未达到“直接监管标准”(一般表现为信息披露不准确或内容不全)的问题时,会针对财务报告、并购重组、关联交易、股票异常波动和媒体报道的社会热点等事件发出问询函,要求上市公司在规定时间内书面回函并公开披露。倘若上市公司仍存在信息披露不准确或不全的问题,交易所会再次问询。
一、数据集详情
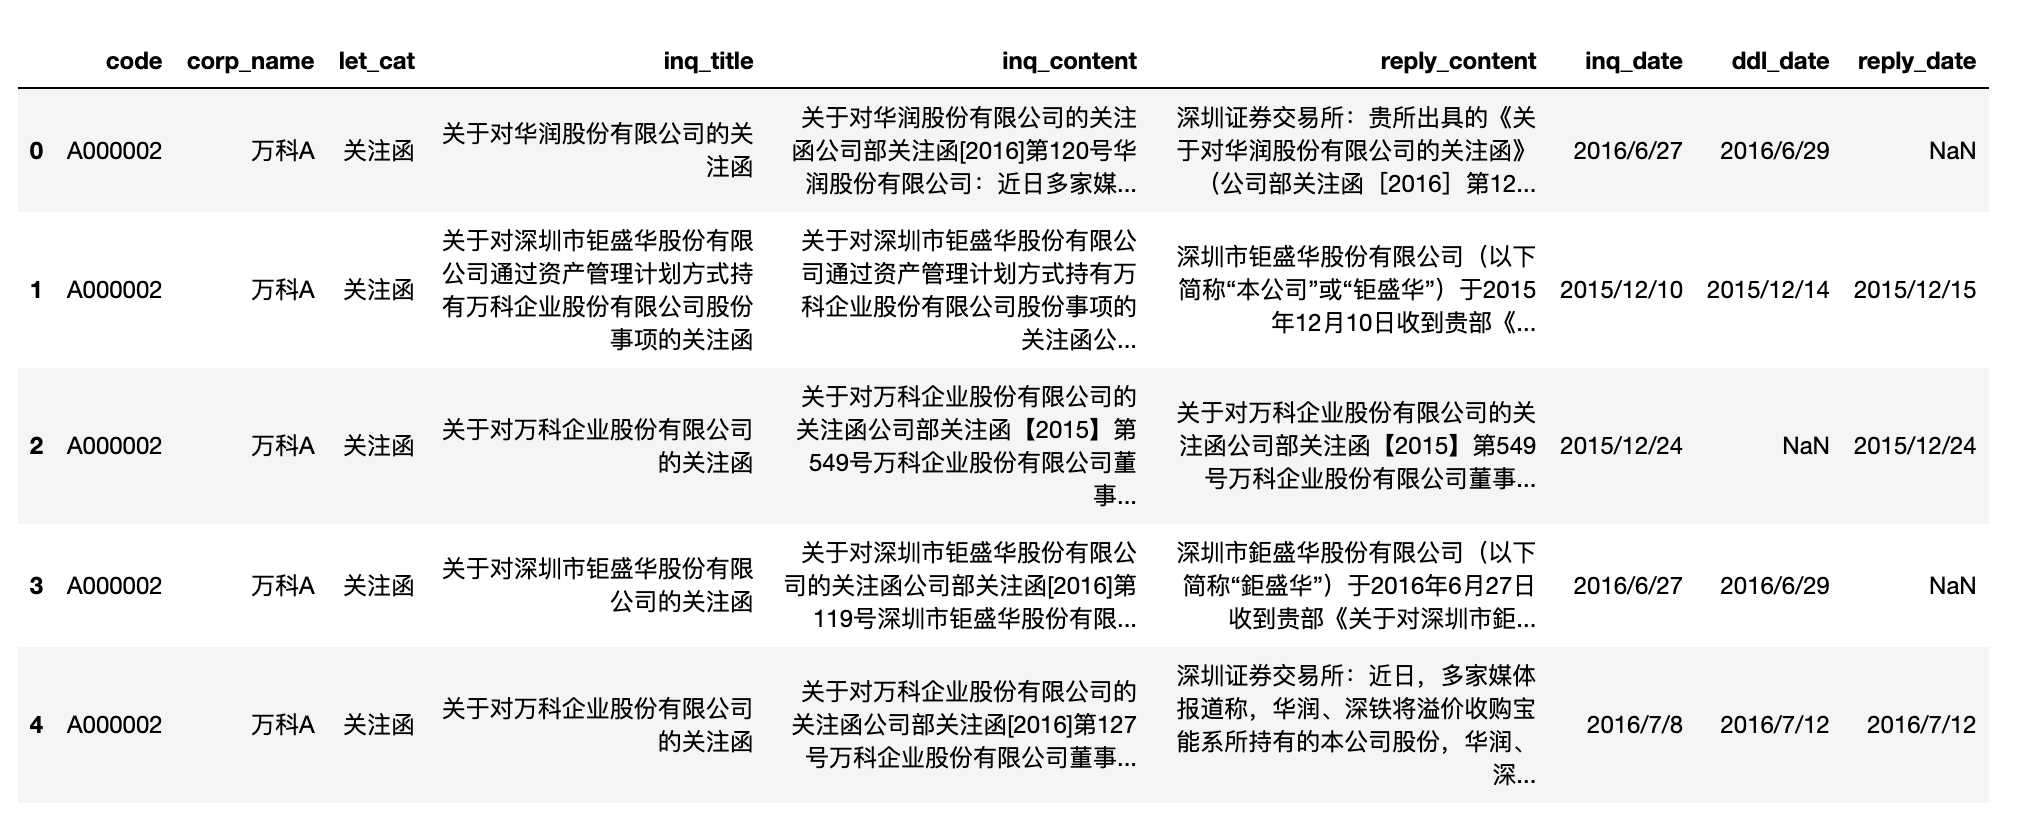
问询数据集,有 14730 条问询记录, 时间范围 2014.12~2023.12, 该数据集xlsx文件有159M 。
| 字段 | 含义 |
|---|---|
| code | 股票代码 |
| corp_name | 上市公司简称 |
| let_cat | 监管机构发出的问询函所属类别 |
| inq_title | 问询函的标题 |
| inq_content | 问询函中询问的具体内容 |
| reply_content | 上市公司回复的详细内容 |
| inq_date | 监管机构发函日期 |
| ddl_date | 规定限期回复日期 |
| reply_date | 公司实际回复日期 |
本文只是小作演示,大家可以结合之前公众号内的分享,做情感分析、词频统计、情感分析等。
声明
科研用途,仅供展示; 如有任何问题,加微信372335839, 备注「姓名-学校-专业-问询函」
二、导入数据
import pandas as pd


df = pd.read_excel('监管问询2014-2023.xlsx')
df.head()
#字段含
df.columns
Run
Index(['code', 'corp_name', 'let_cat', 'inq_title', 'inq_content',
       'reply_content', 'inq_date', 'ddl_date', 'reply_date'],
          dtype='object')
#数据量
len(df)
Run
14731
三、数据分析
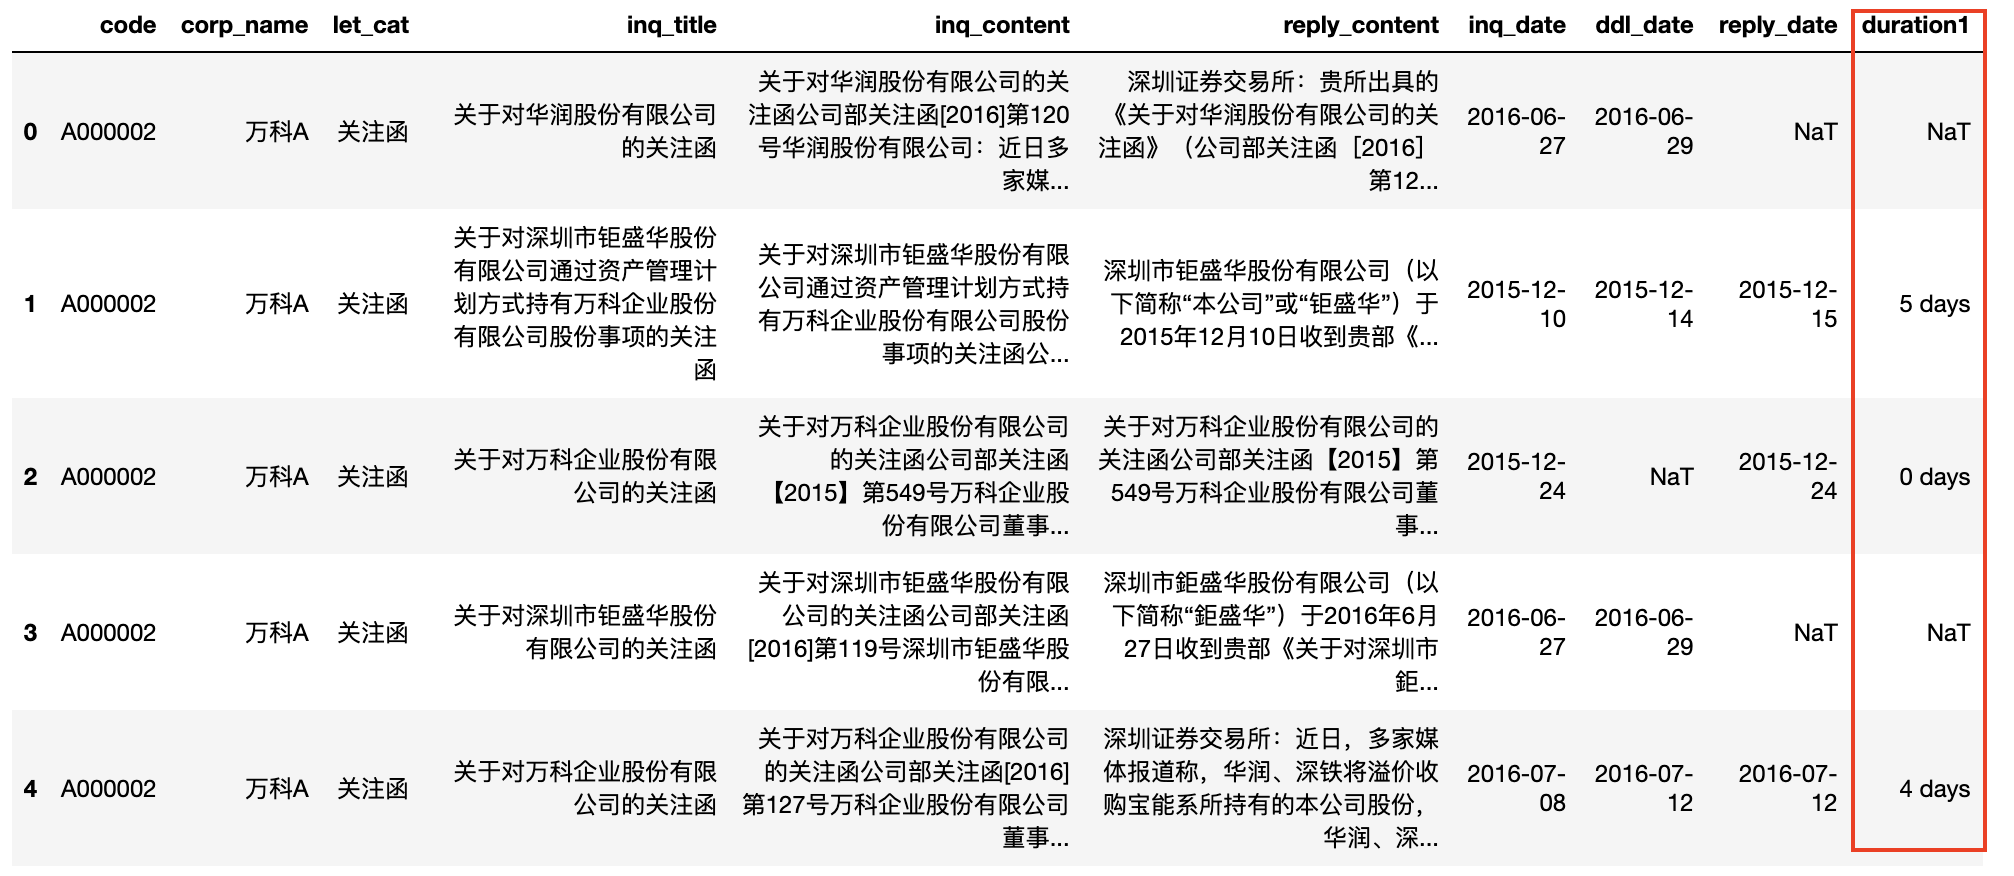
3.1 更改日期格式
将日期字符串数据改为datetime类型数据,即可做日期间隔的计算。这里只演示公司回复日期与监管机构发函日期时间间隔。
df = df[df.code!='股票代码'] #剔除第一行(字段名)
df['inq_date'] = pd.to_datetime(df['inq_date'])
df['ddl_date'] = pd.to_datetime(df['ddl_date'])
df['reply_date'] = pd.to_datetime(df['reply_date'])
df['duration1'] = df['reply_date'] - df['inq_date']
df.head()

#数据集的时间跨度
print(df['inq_date'].min())
print(df['inq_date'].max())
Run
2014-12-04 00:00:00
2023-12-30 00:00:00
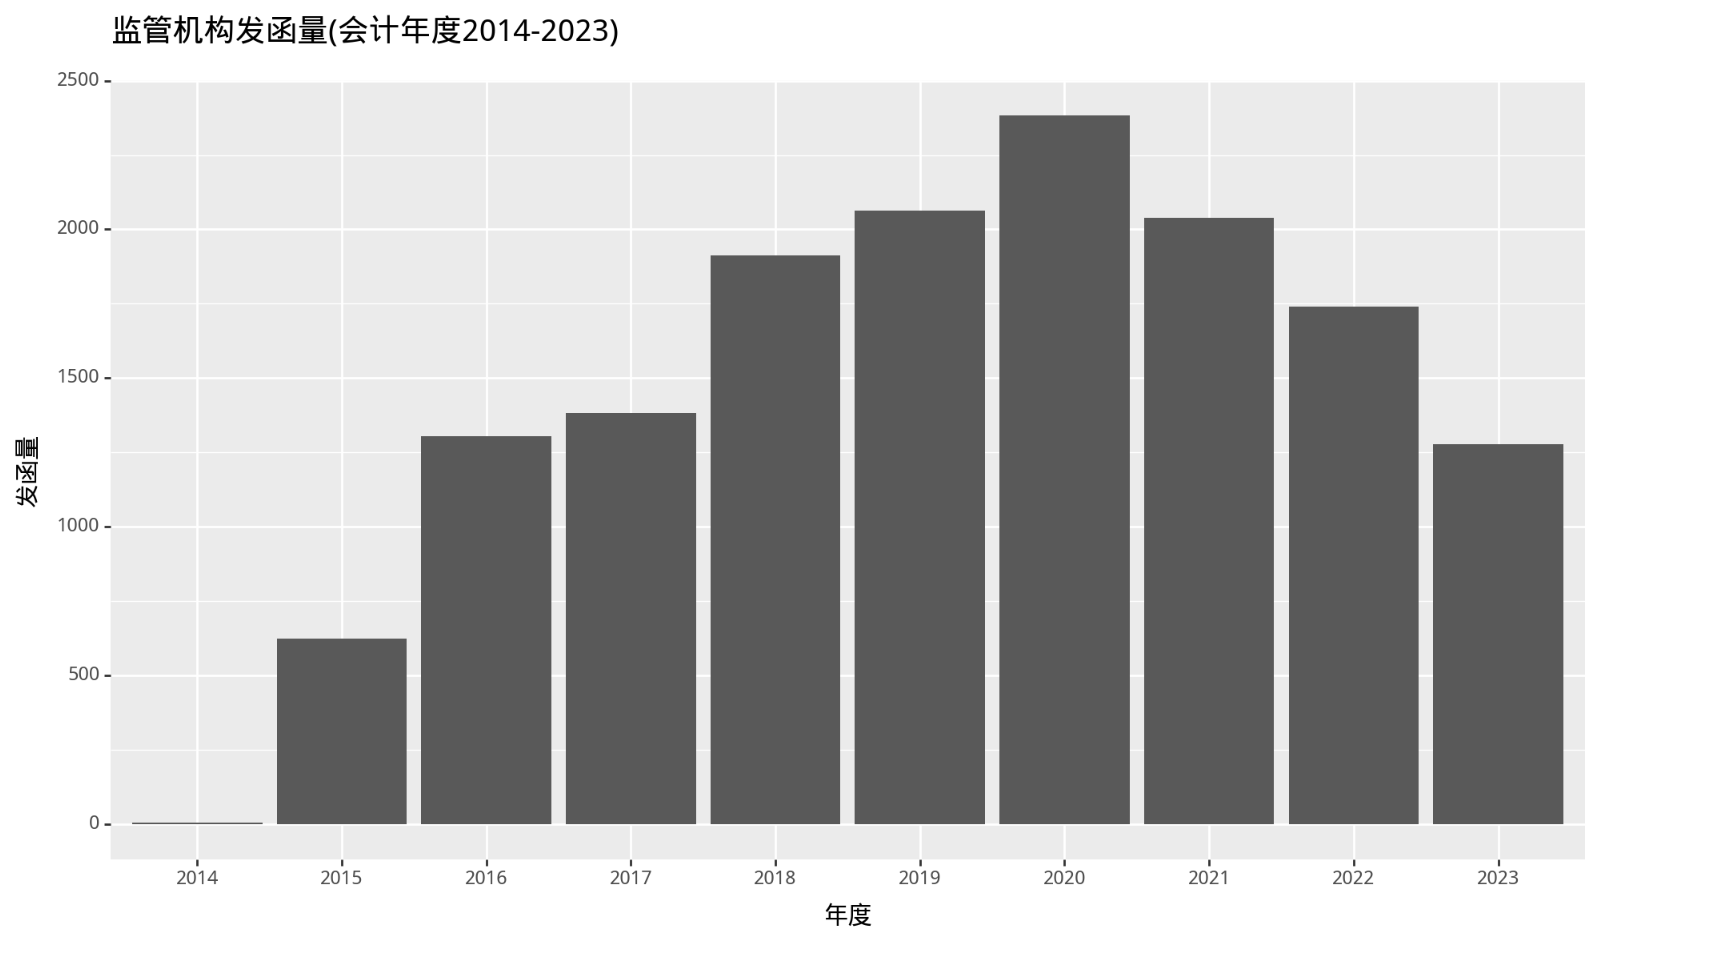
3.2 发函量年度变化
随着我国金融市场发展,监管越来越到位,再加上上市公司会越来越多, 监管机构发函量年度变化应该是越来越多。
from plotnine import *
import matplotlib.pyplot as plt
from matplotlib.font_manager import FontProperties

#文泉驿微米黑.ttf位于代码同文件夹
font_prop = FontProperties(fname='文泉驿微米黑.ttf')

stats_df = df['inq_date'].dt.year.value_counts().reset_index().sort_values('inq_date', ascending=True)
stats_df.columns = ['year', 'volume']
stats_df['year'] = stats_df['year'].astype('category')


(
    ggplot(stats_df,  aes(x='year', y='volume'))
    +geom_col()
    +theme(figure_size=(10, 6),
           text = element_text(family = font_prop.get_name()),
           plot_title = element_text(family = font_prop.get_name(), size=14)
          )
    +labs(title='监管机构发函量(会计年度2014-2023)',
          x = '年度',
          y = '发函量')
)
3.3 问询回复间隔
从监管机构发起问询与公司回复之间的时间差, 按道理
df['duration1'] = df['duration1'].dt.days
df.head()
sz_mean = df[df['code'].str.startswith('A0')].duration1.mean()
sh_mean = df[df['code'].str.startswith('A6')].duration1.mean()

print('深市平均回复时间', sz_mean)
print('沪市平均回复时间', sh_mean)
Run
深市平均回复时间 14.02757813805783
沪市平均回复时间 23.929029078363726
似乎沪市的上市公司回复的更慢
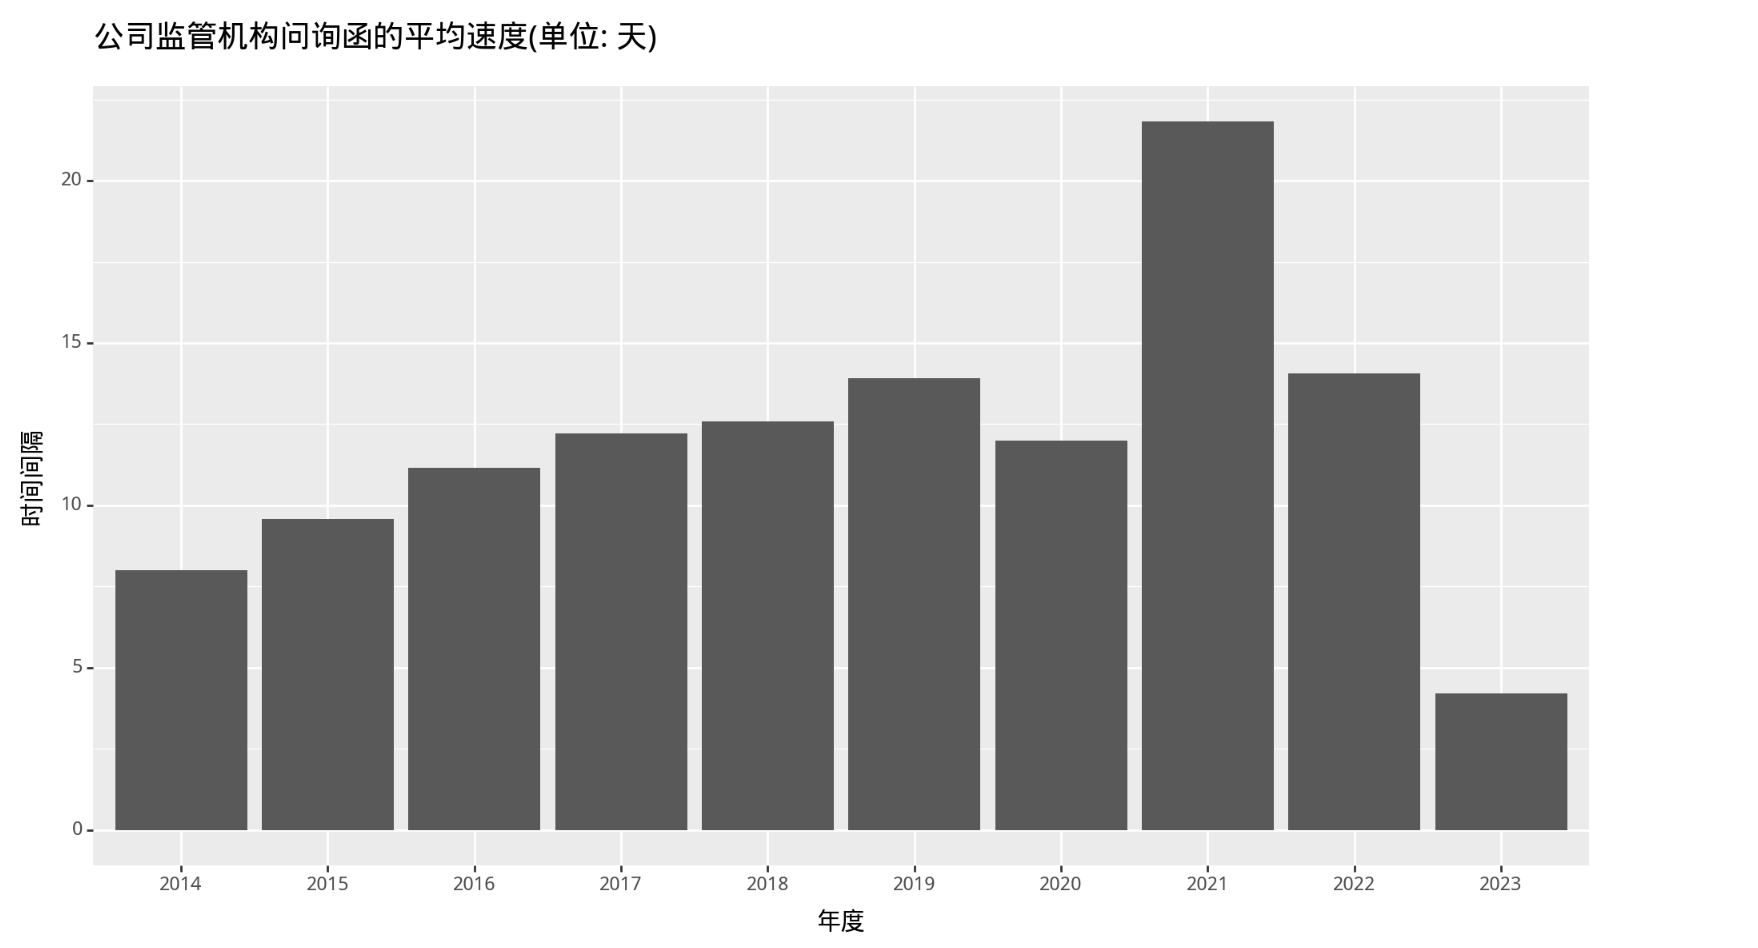
3.4 公司回复速度
公司回复问询函的速度是越来越快还是越来越久?
from plotnine import *
import matplotlib.pyplot as plt
from matplotlib.font_manager import FontProperties

#文泉驿微米黑.ttf位于代码同文件夹
font_prop = FontProperties(fname='文泉驿微米黑.ttf')


reply_stats_df = df.groupby(df['inq_date'].dt.year)['duration1'].mean().reset_index().sort_values('inq_date', ascending=True)
reply_stats_df.columns = ['year', 'reply_speed']
reply_stats_df['year'] = reply_stats_df['year'].astype('category')

(
    ggplot(reply_stats_df,  aes(x='year', y='reply_speed'))
    +geom_col()
    +theme(figure_size=(10, 6),
           text = element_text(family = font_prop.get_name()),
           plot_title = element_text(family = font_prop.get_name(), size=14)
          )
    +labs(title='公司监管机构问询函的平均速度(单位: 天)',
          x = '年度',
          y = '时间间隔')
)
3.4 文本长度静态对比
不考虑时间,比较沪深问询函内容及回复内容文本长度
df['inq_len'] =  df['inq_content'].str.len()
df['reply_len'] =  df['reply_content'].str.len()


sz_inq_len_mean = df[df['code'].str.startswith('A0')].inq_len.mean()
sh_inq_len_mean = df[df['code'].str.startswith('A6')].inq_len.mean()

print('深市-监管机构平均问询函内容长度', sz_inq_len_mean)
print('沪市-监管机构平均问询函内容长度', sh_inq_len_mean)
print('-'*40, '\n')


sz_reply_len_mean = df[df['code'].str.startswith('A0')].reply_len.mean()
sh_reply_len_mean = df[df['code'].str.startswith('A6')].reply_len.mean()

print('深市公司平均回复长度', sz_reply_len_mean)
print('沪市公司平均回复时间', sh_reply_len_mean)
Run
深市-监管机构平均问询函内容长度 1947.5390460109752
沪市-监管机构平均问询函内容长度 1998.5633954154728
----------------------------------------

深市公司平均回复长度 13677.95808477237
沪市公司平均回复时间 17027.80131208997
似乎监管机构对沪市公司发起的问询内容更长, 而沪市的上市公司对应回应问询的内容也更长。
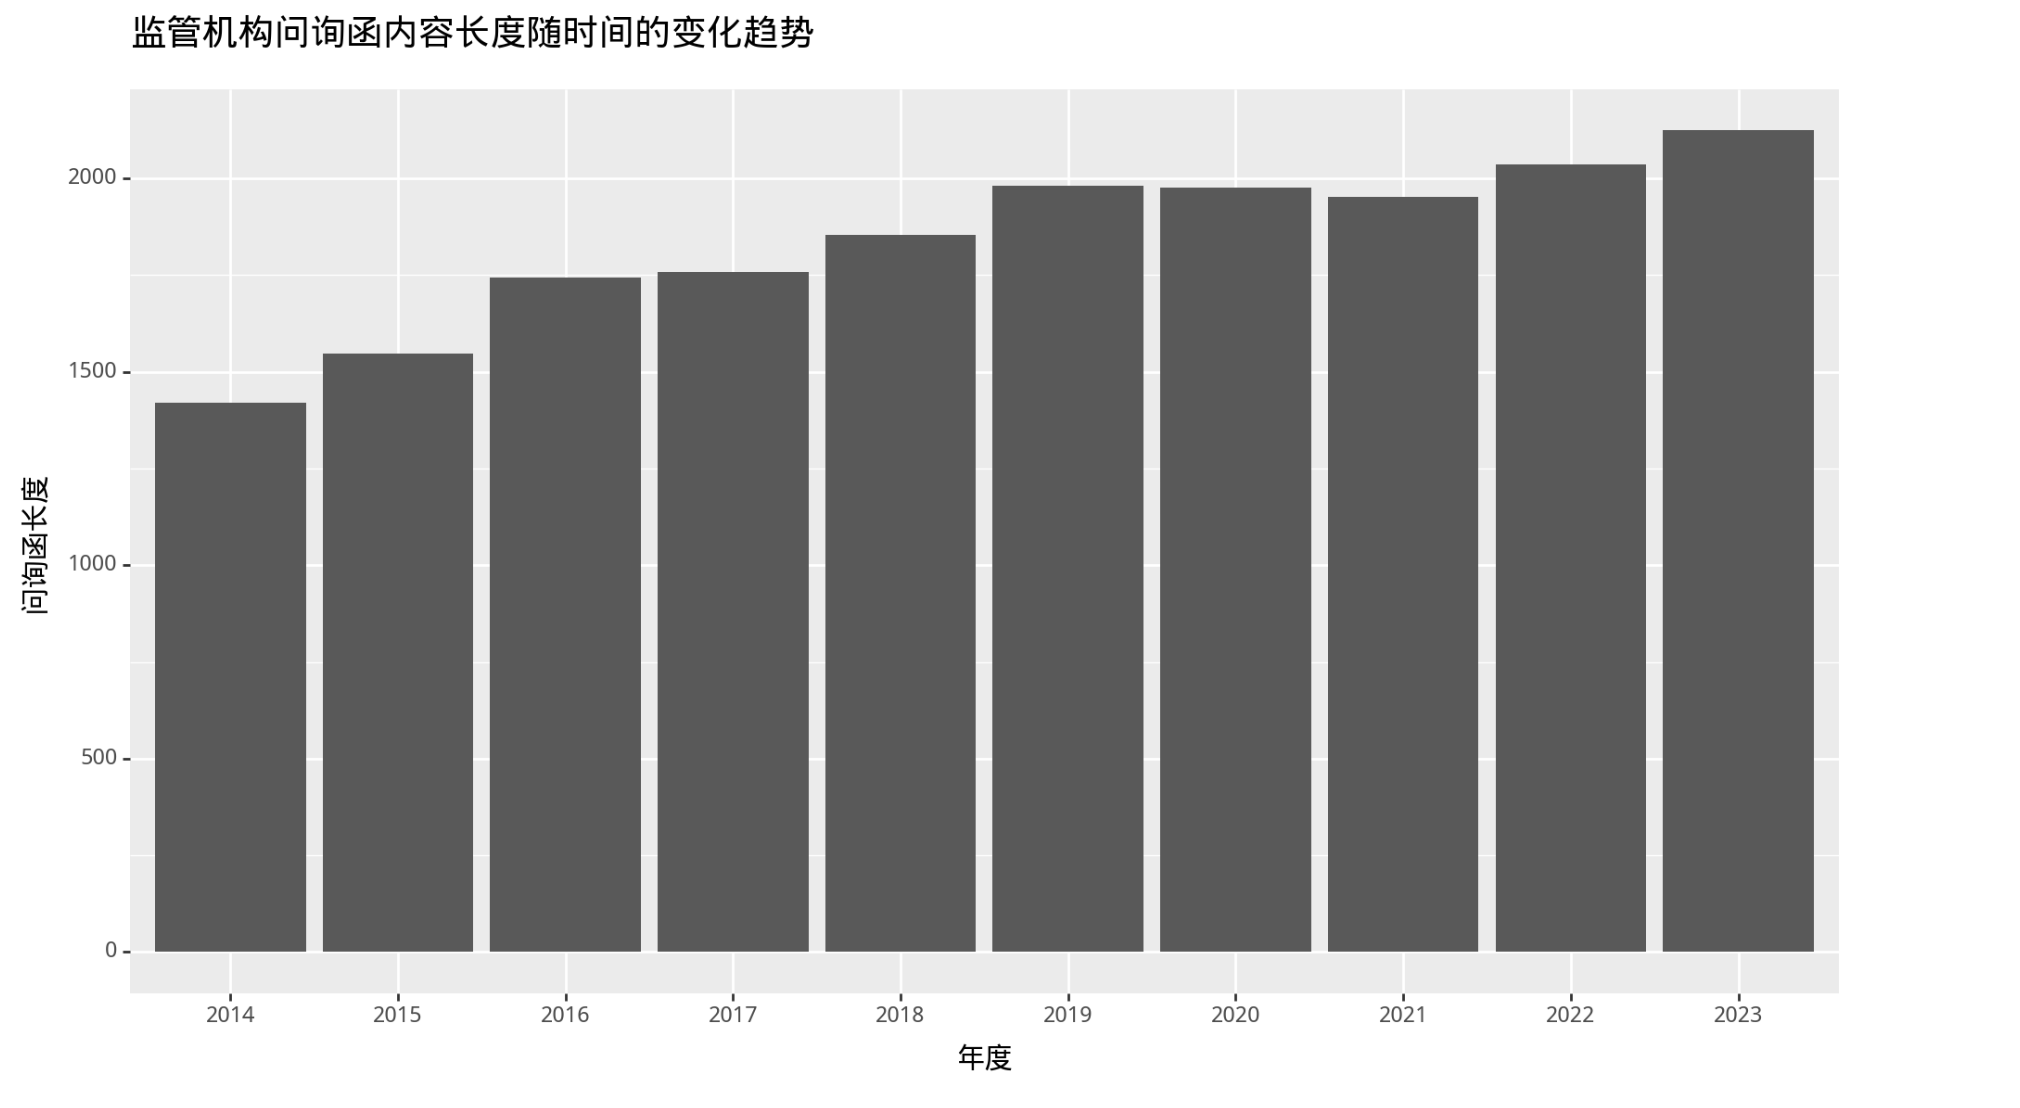
3.5 随时间文本长度变化
reply_len_stats_df = df.groupby(df['inq_date'].dt.year)['inq_len'].mean().reset_index().sort_values('inq_date', ascending=True)
reply_len_stats_df.columns = ['year', 'text_len']
reply_len_stats_df['year'] = reply_len_stats_df['year'].astype('category')


(
    ggplot(reply_len_stats_df,  aes(x='year', y='text_len'))
    #+geom_point()
    +geom_col()
    +geom_line()
    +theme(figure_size=(10, 6),
           text = element_text(family = font_prop.get_name()),
           plot_title = element_text(family = font_prop.get_name(), size=14)
          )
    +labs(title='监管机构问询函内容长度随时间的变化趋势',
          x = '年度',
          y = '问询函长度')
)