prettymaps库是用于从 OpenStreetMap 数据绘制漂亮的地图, 基于 osmnx、matplotlib 和 shapely 库开发而来。
Gallery
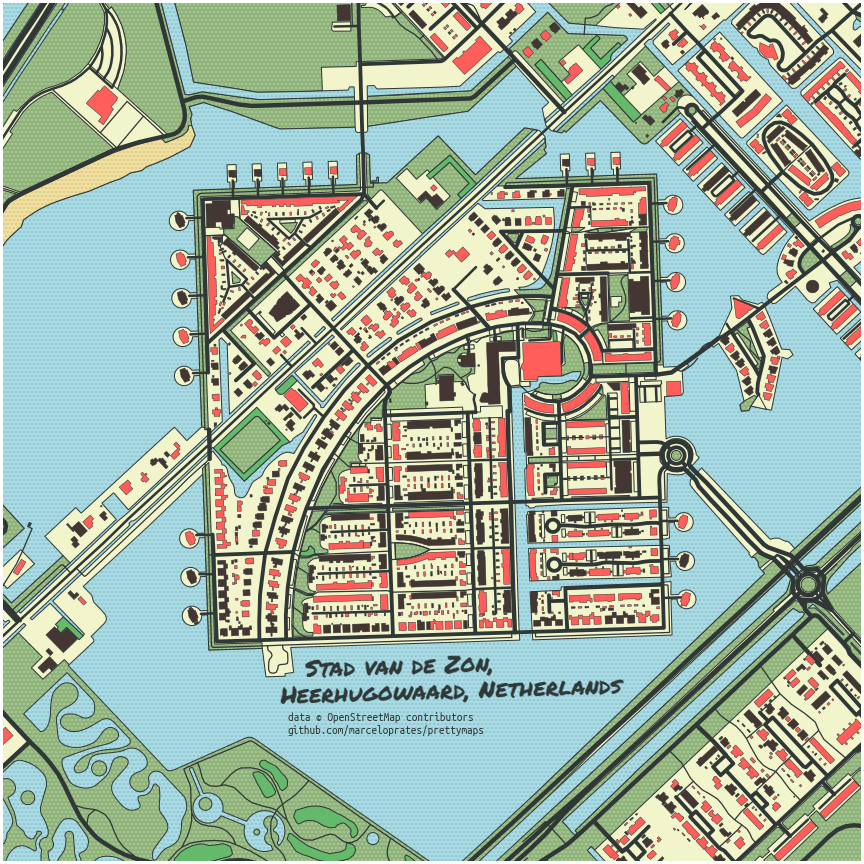
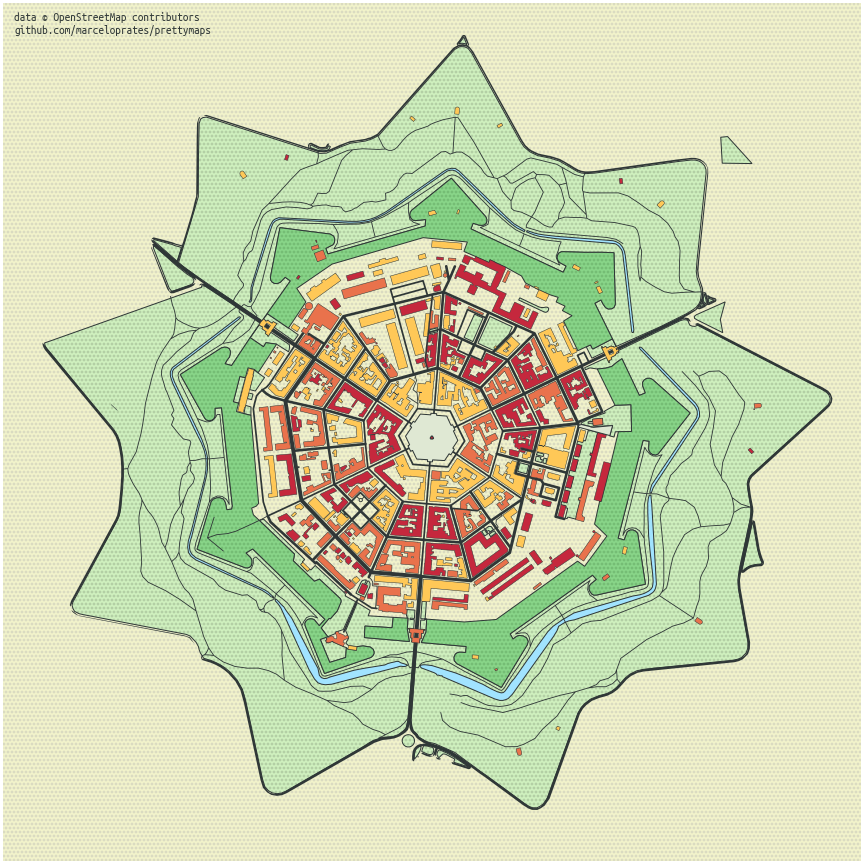
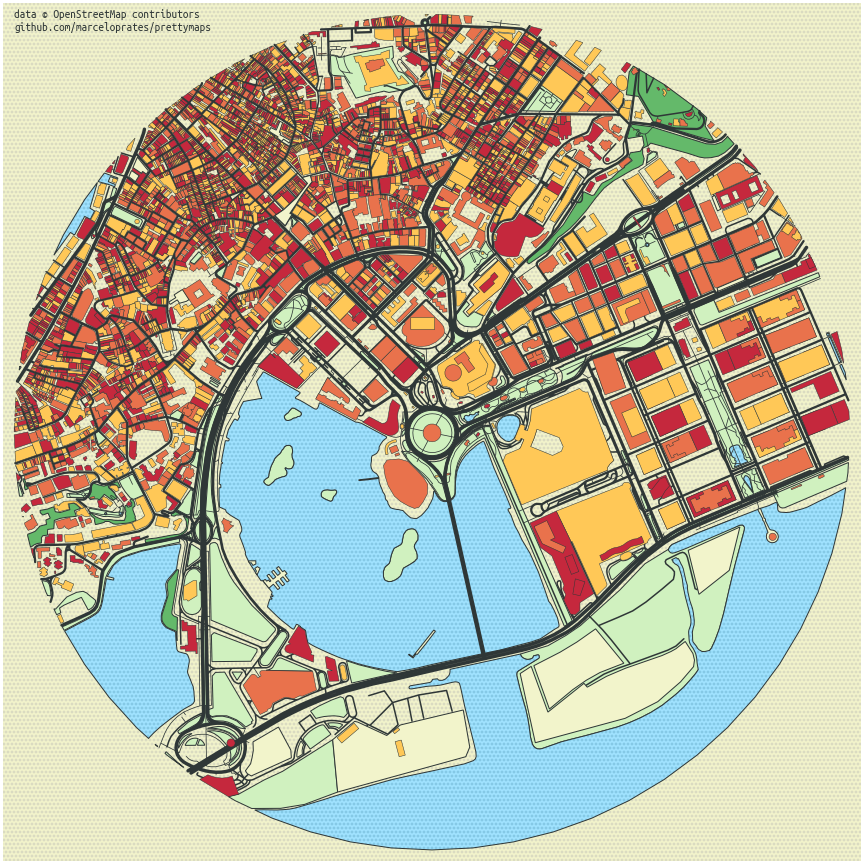
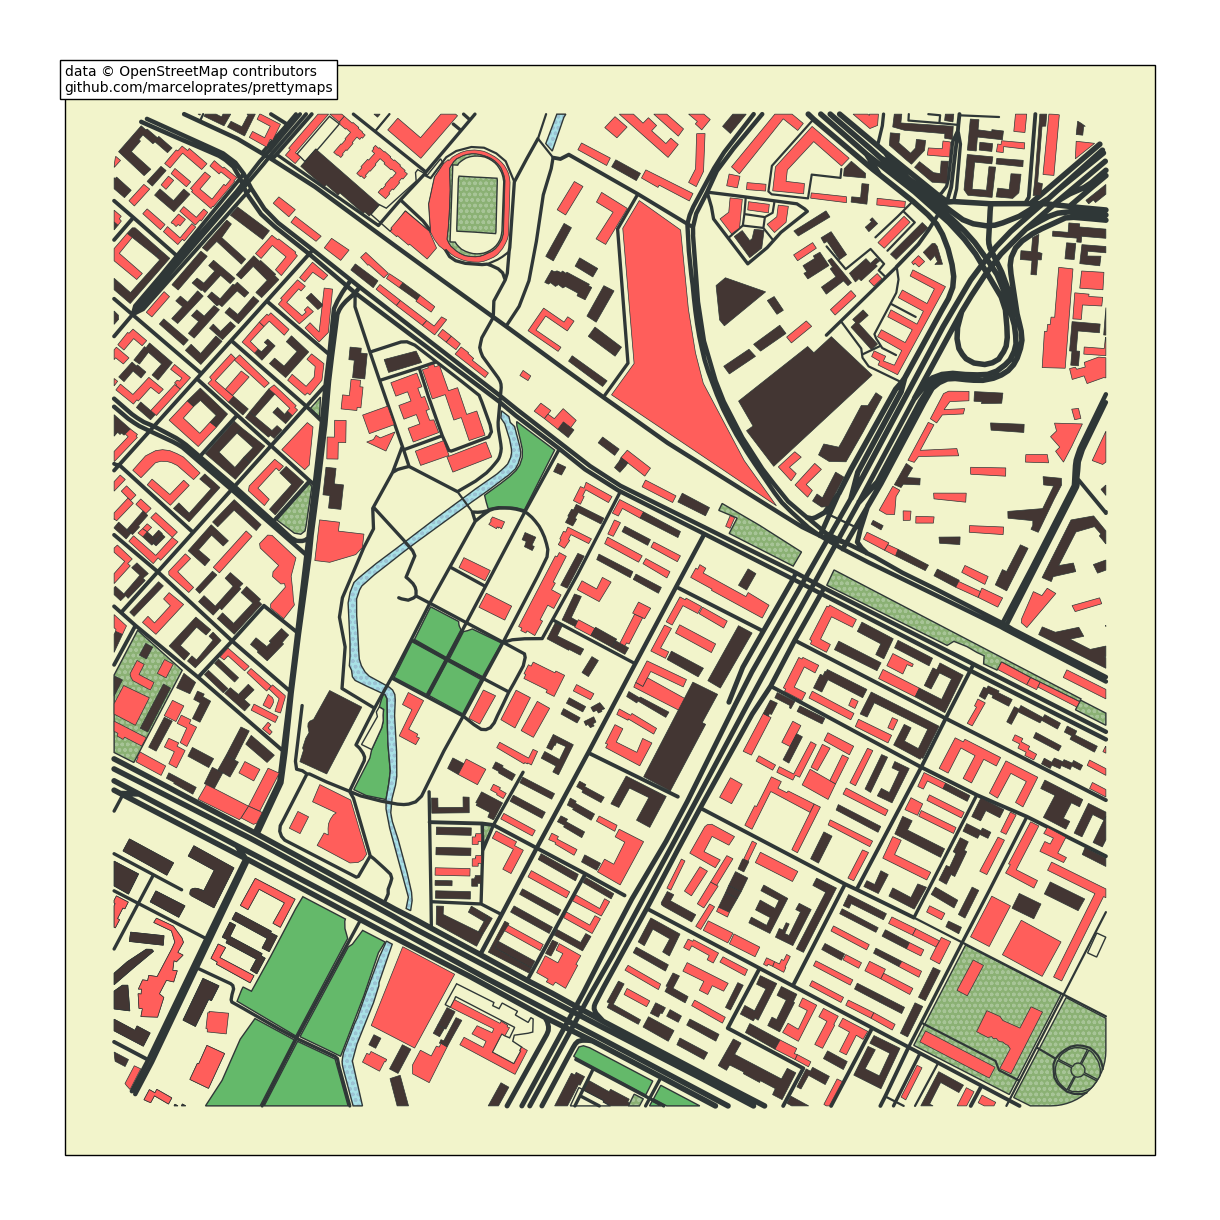
下面是prettymaps绘制的样例,

安装
!pip3 install prettymaps
快速上手
使用 prettymaps 库绘制可视化地图很简单,只需要使用
prettymaps.plot(your_query)
your_query有以下三种方式
- 地址 (Example: “Porto Alegre”),
- 纬度/经度 (Example: (-30.0324999, -51.2303767))
- GeoDataFrame格式数据
这里以哈工大科学园地图为例, 使用 维度/经度 坐标绘制。

import prettymaps
import matplotlib.pyplot as plt

#哈工大科学园2H栋
plot = prettymaps.plot(
   (45.73022857604175, 126.63157734342359),
    preset = 'heerhugowaard',
)

plt.show()
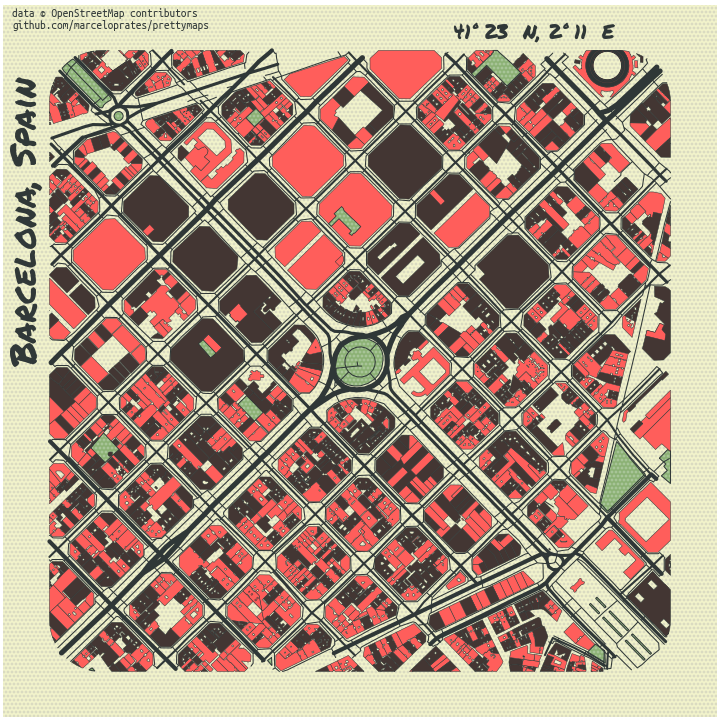
import prettymaps
from matplotlib import pyplot as plt

plot = prettymaps.plot(
    (41.39491,2.17557),
    preset = 'barcelona',
)

# Change background color
plot.fig.patch.set_facecolor('#F2F4CB')
# Add title
plot.ax.set_title('Barcelona')

plt.savefig(fname='barcelona.png', dpi=100)

plt.show()