
本章技术要点:
- 读取一个txt, 然后按照n等份整理为dataframe
- 词频统计&绘制词云图
- 假设内容分成20份(带顺序),可视化情绪变化趋势
- 假设内容分成20份(带顺序),可视化相邻内容的相似度变化趋势
一、读入小说
把自传数据等分成20份,默认每一份代表一个时期。
import pandas as pd
def read_txt(file, num_segments, encoding='utf-8'):
# 读取txt文件
with open(file, "r", encoding=encoding) as f:
text = f.read()
# 获取文本的总长度和每一段的长度
total_length = len(text)
segment_length = total_length // num_segments
# 将文本分割成指定数量的段落
segments = []
for i in range(num_segments):
start = i * segment_length
end = (i + 1) * segment_length
if i == num_segments - 1:
end = total_length
segment = text[start:end]
segments.append(segment)
# 将内容存储在数据框中
df = pd.DataFrame(segments, columns=["doc"])
return df
#分成20份
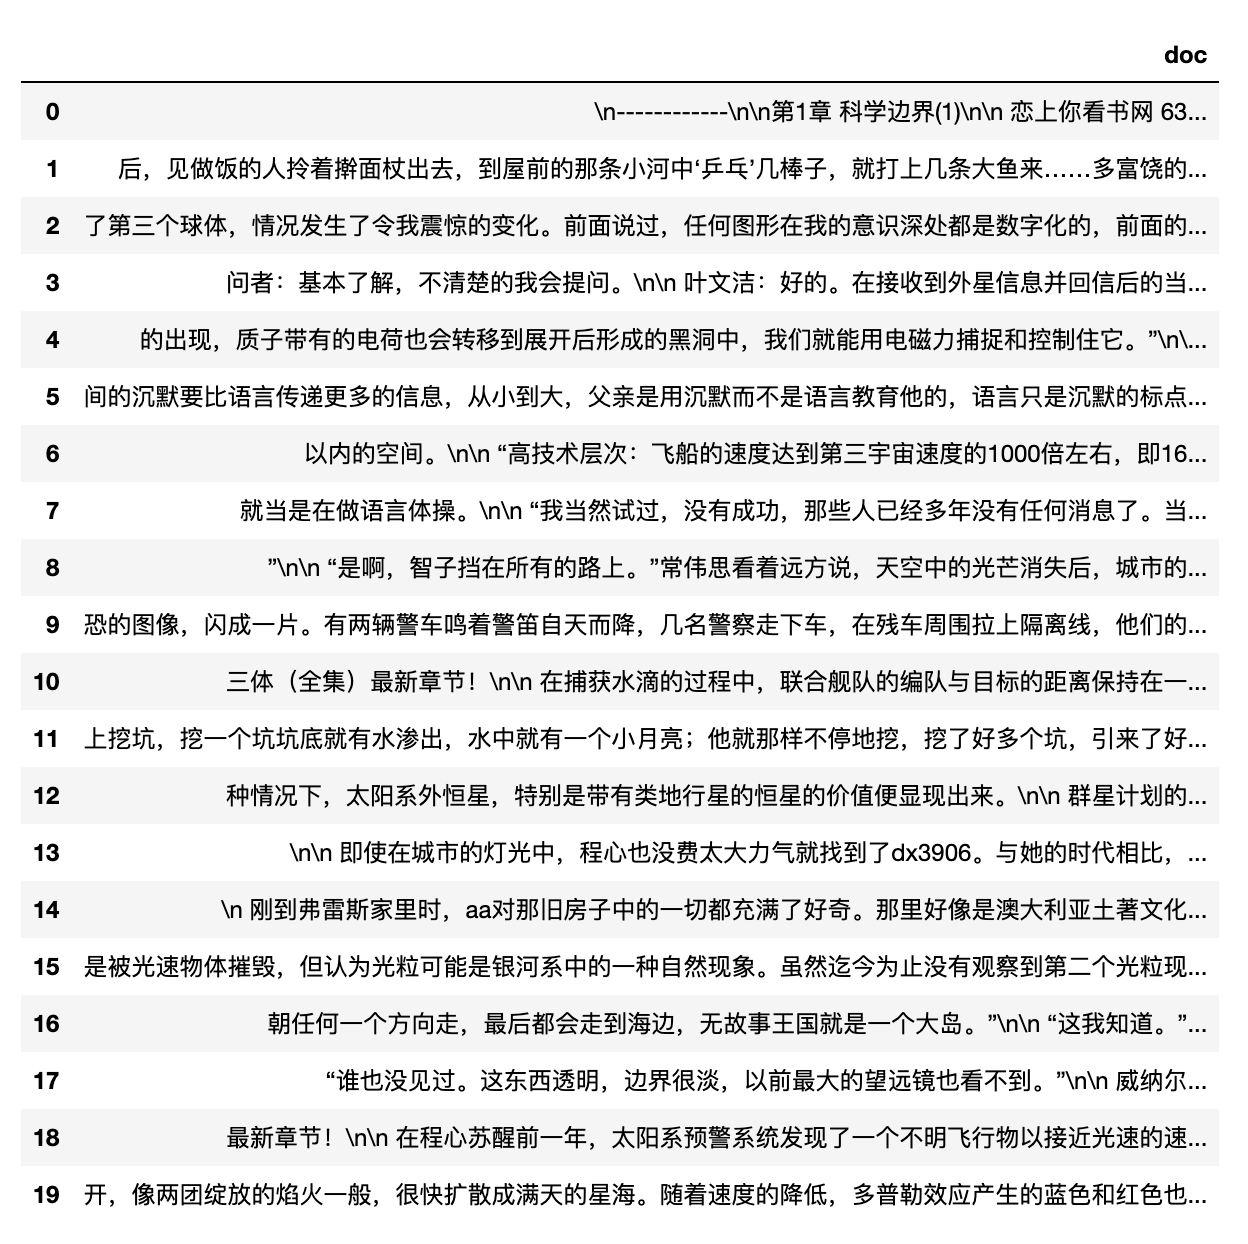
df = read_txt(file='data/三体.txt', num_segments=20)
df
二、清洗数据
- 剔除非中文字符
- 去除停用词
import jieba
import re
import cntext as ct
#1.8.4版本cntext
#如需安装 pip3 install cntext==1.8.4

stopwords = ct.load_pkl_dict('STOPWORDS.pkl')['STOPWORDS']['chinese']

def clean(doc):
    #剔除非中文字符
    doc = re.sub('[^\u4e00-\u9fa5]', '', doc)
    words = jieba.lcut(doc)
    words = [w for w in words if w not in stopwords]
    return words


clean(doc='质子带有的电荷也会转移到展开后形成的黑洞中,我们就能用电磁力捕捉和控制住它。')
Building prefix dict from the default dictionary ...
Loading model from cache /var/folders/y0/4gqxky0s2t94x1c1qhlwr6100000gn/T/jieba.cache
Loading model cost 0.428 seconds.
Prefix dict has been built successfully.

['质子', '带有', '电荷', '转移', '展开', '形成', '黑洞', '电磁力', '捕捉', '控制', '住']
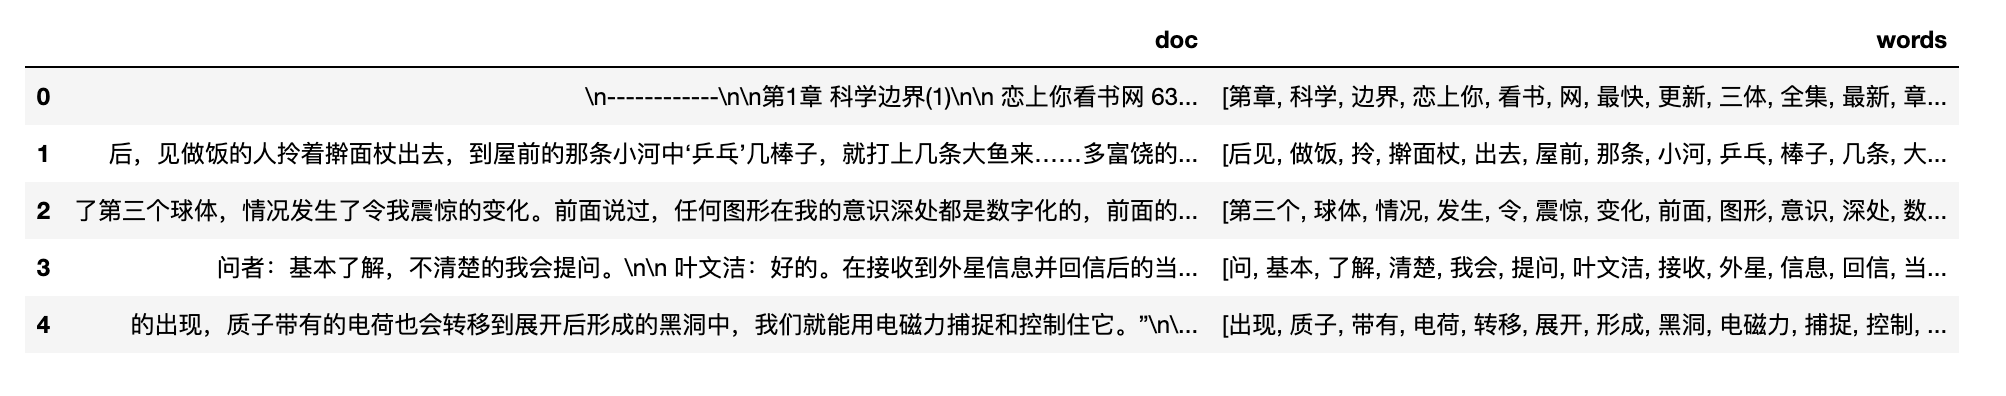
df['words'] = df.doc.apply(clean)
df.head()
三、可视化
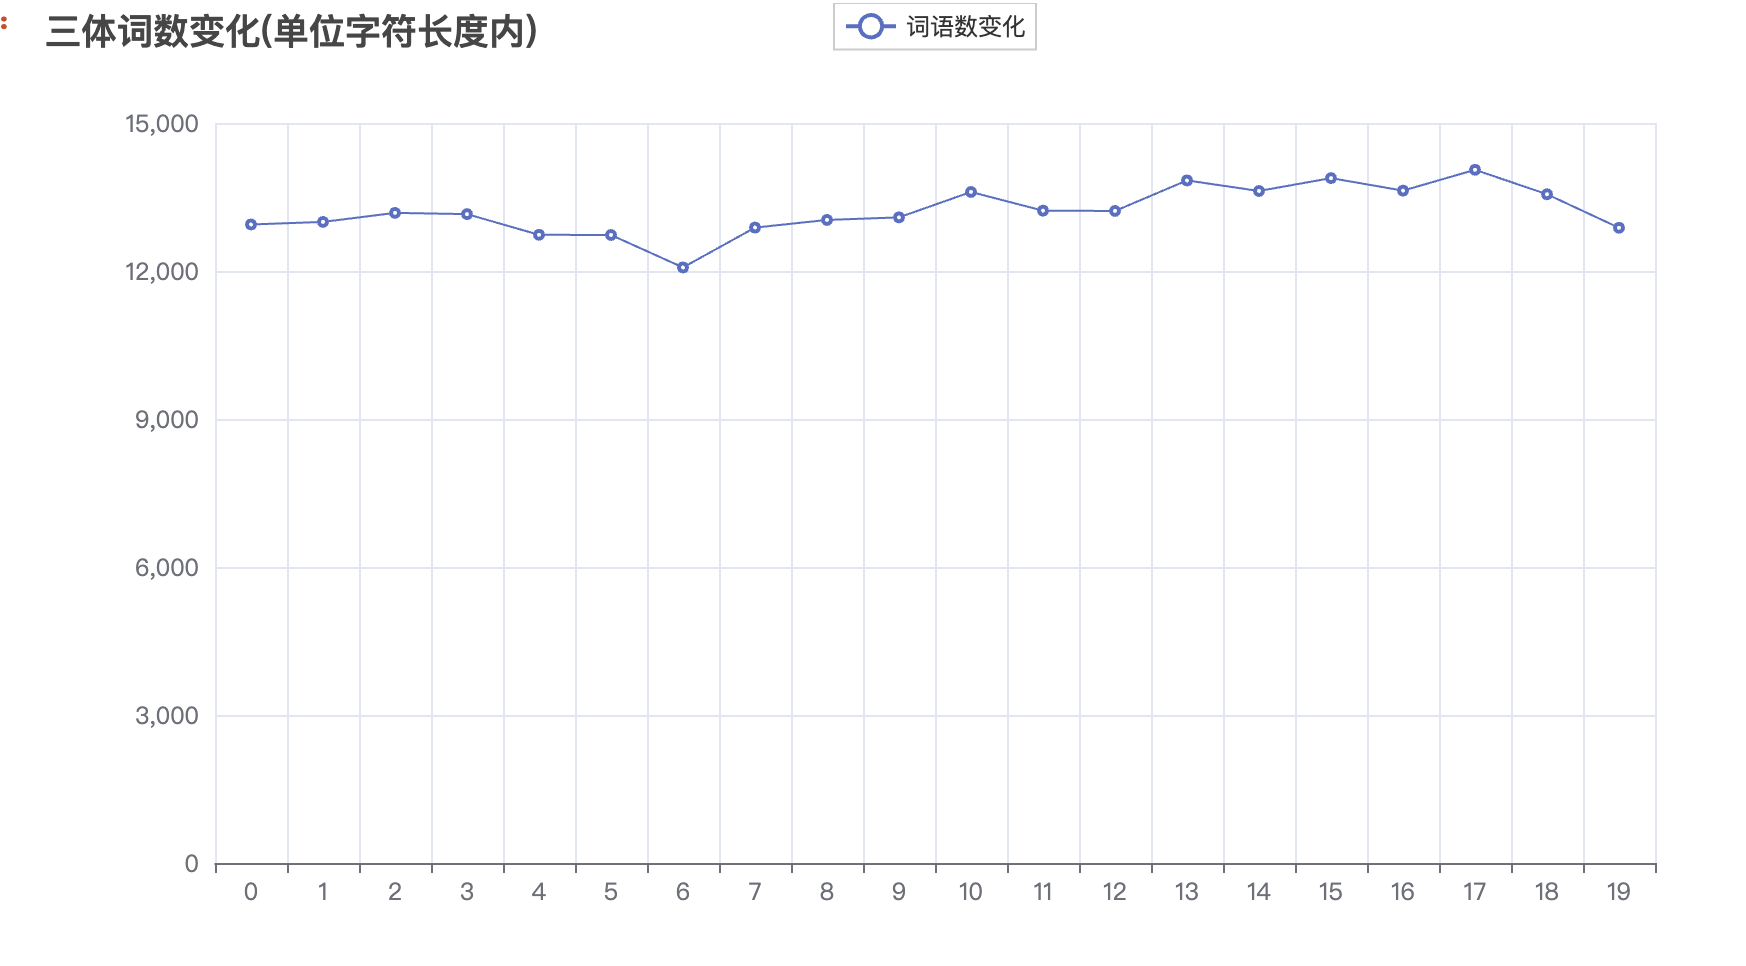
3.1 词数变化
小说分成了20部分,每部分字符长度是相同的。但是因为章节内容不同,用词的复杂度会有变化,即单位长度内词语平均数据量。
from pyecharts.charts import Line
from pyecharts import options as opts
from pyecharts.globals import CurrentConfig, NotebookType
CurrentConfig.NOTEBOOK_TYPE = NotebookType.JUPYTER_NOTEBOOK

word_nums = df.words.apply(lambda words: len(words))

line = Line()

line.add_xaxis(xaxis_data=list(range(20)))

line.add_yaxis("词语数变化",
               word_nums,
               label_opts=opts.LabelOpts(is_show=False))

line.set_global_opts(title_opts=opts.TitleOpts(title="三体词数变化(单位字符长度内)"))

line.load_javascript()
line.render('三体词数变化(单位字符长度内).html')
line.render_notebook()
3.2 词云图
import jieba
from pyecharts import options as opts
from pyecharts.charts import WordCloud
import re

text = ''.join(df.doc)
text = re.sub('[^\u4e00-\u9fa5]+', '', text)
words = jieba.lcut(text)
words = [w for w in words if len(w)>1]

records = []
for w in set(words):
    freq = words.count(w)
    records.append((w, freq))


records = sorted(records, key=lambda k:k[1], reverse=True)
wordcounts = [(w, str(f)) for w,f in records]

wc = WordCloud()
wc.add(series_name="", data_pair=wordcounts, word_size_range=[20, 100])
wc.set_global_opts(
        title_opts=opts.TitleOpts(title="三体词云图", title_textstyle_opts=opts.TextStyleOpts(font_size=23)
        ),
        tooltip_opts=opts.TooltipOpts(is_show=True),
    )


wc.render("三体词云图.html")  #存储位置
wc.render_notebook()

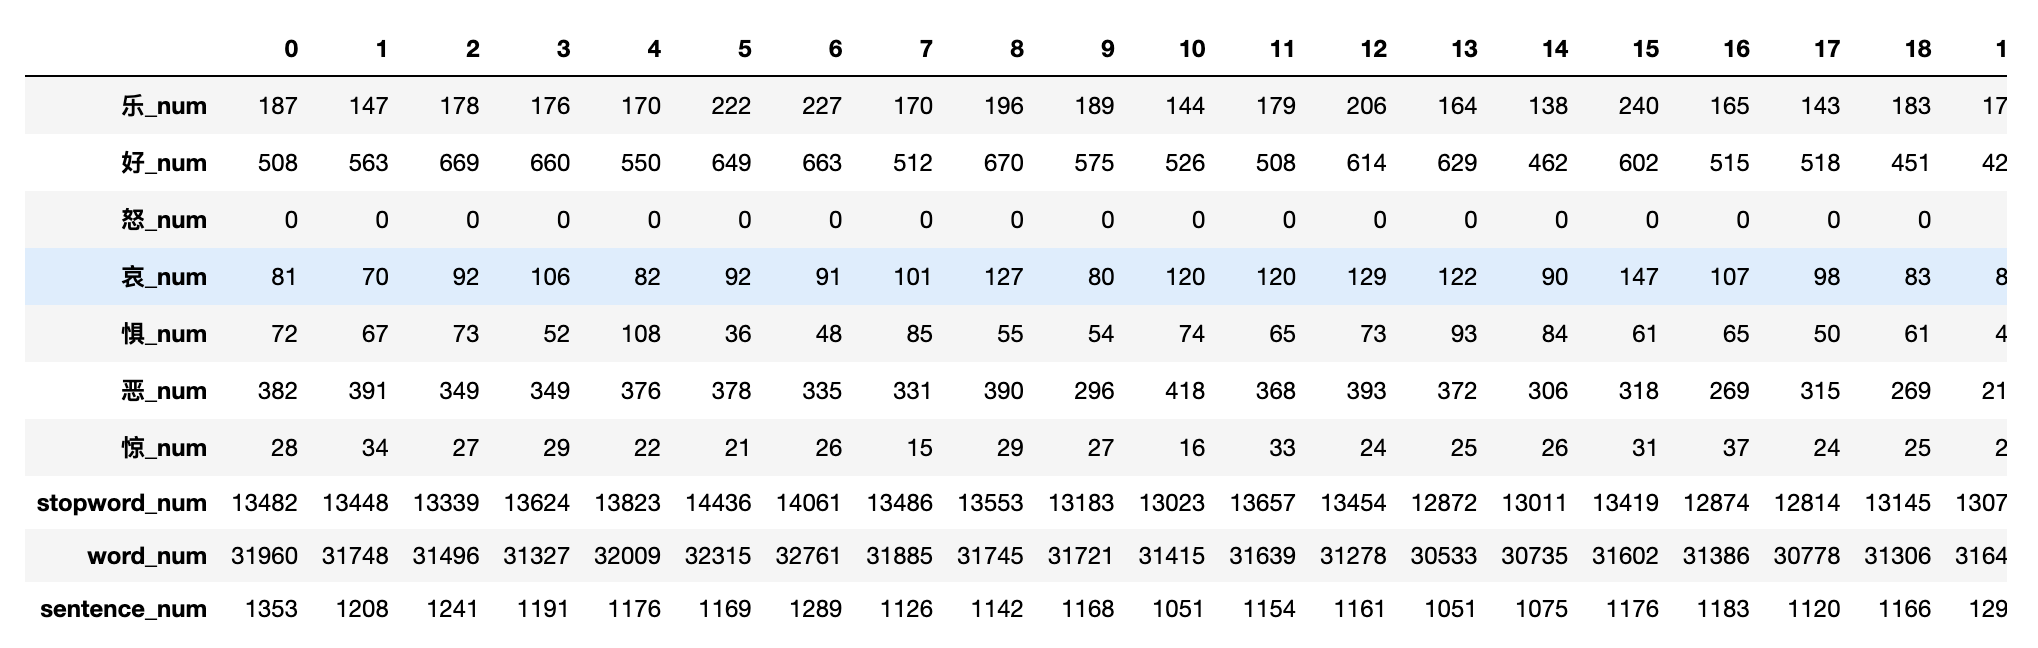
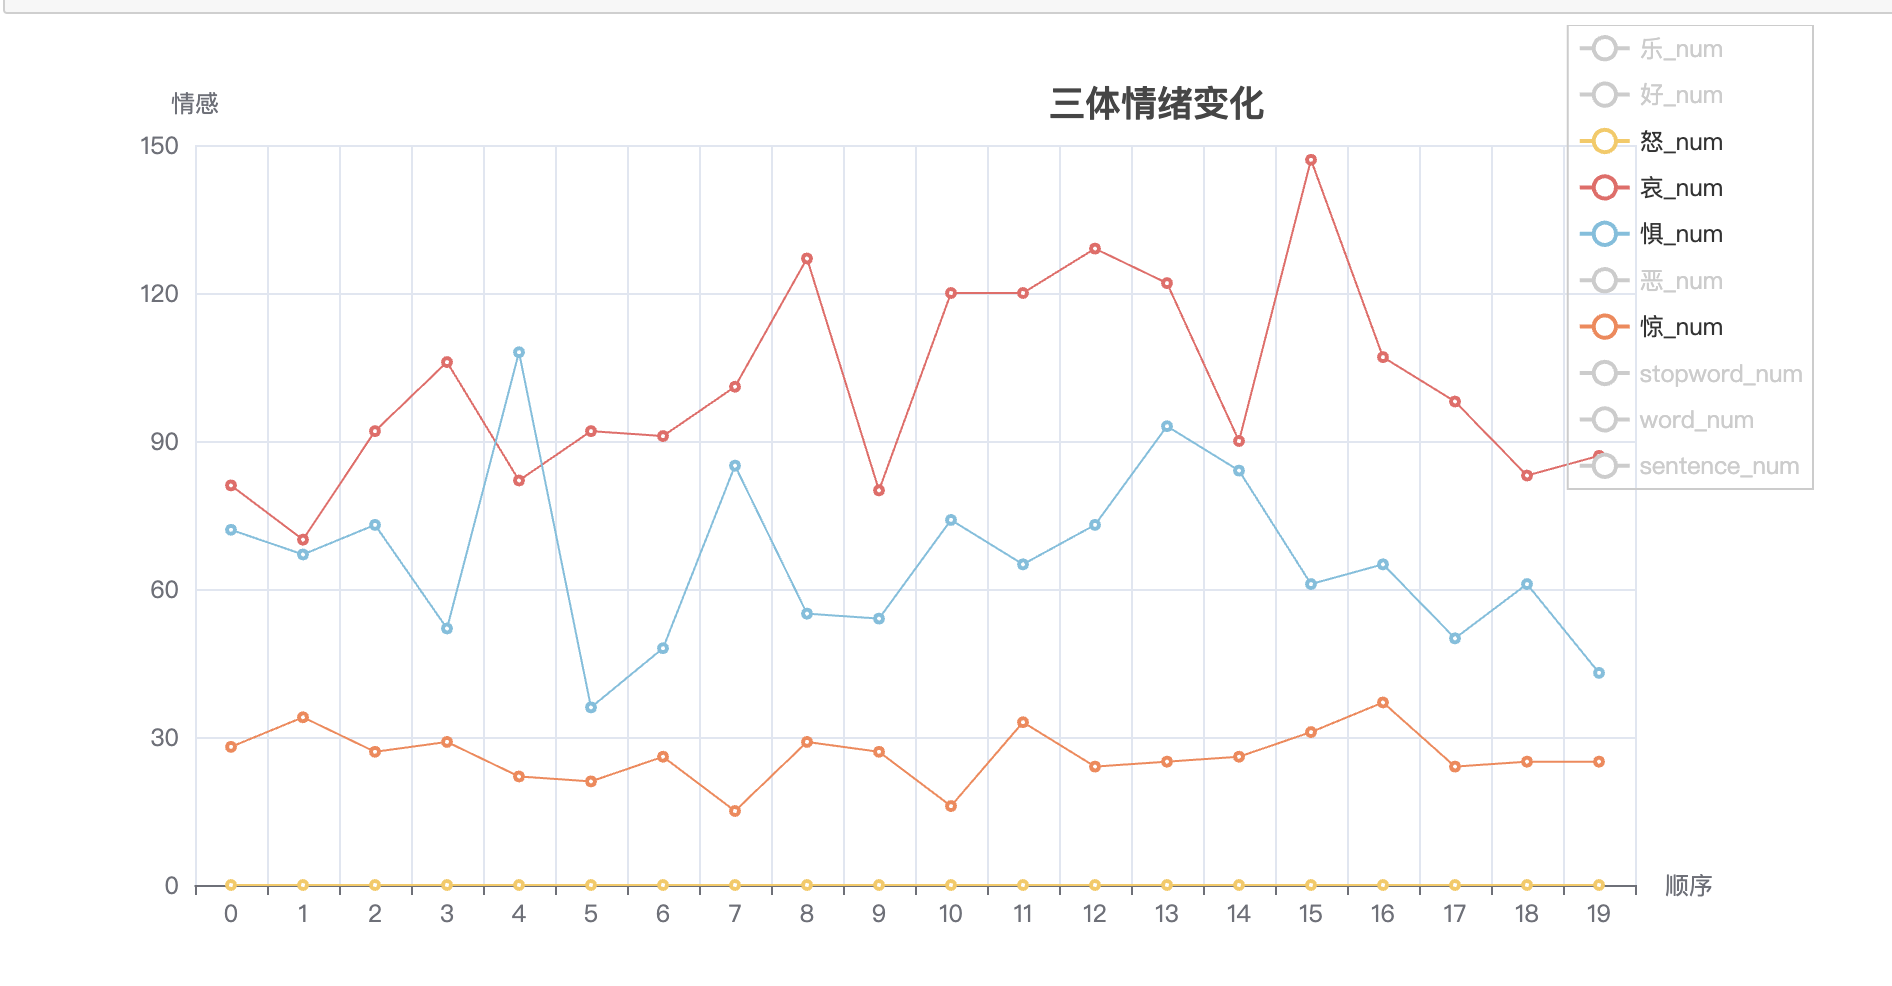
3.3 情绪可视化
使用DUTIR细粒度情感词典,绘制7种情绪在三体小说中的变化趋势
def emotion_count(text):
    res = ct.sentiment(text=text,
             diction=ct.load_pkl_dict('DUTIR.pkl')['DUTIR'],
             lang='chinese')
    return pd.Series(res)


text = '被光速物体摧毁,但认为光粒可能是银河系中的一种自然现象。虽然迄今为止没有观察到第二个光粒现'
emotion_count(text=text)
Run
乐_num            0
好_num            0
怒_num            0
哀_num            1
惧_num            0
恶_num            0
惊_num            0
stopword_num     9
word_num        23
sentence_num     2
dtype: int64
emotion_df = df.doc.apply(emotion_count).T
emotion_df
from pyecharts import options as opts
from pyecharts.charts import Line

line_chart = Line()

line_chart.add_xaxis(xaxis_data=emotion_df.columns.tolist())

for linename in emotion_df.index:
    linedata = emotion_df.loc[linename].tolist()
    line_chart.add_yaxis(series_name = linename,
                         y_axis=linedata,
                         label_opts=opts.LabelOpts(formatter="{b}",
                                                   position="right",
                                                   is_show=False))

line_chart.set_global_opts(
        title_opts=opts.TitleOpts(title='三体情绪变化',
                                  pos_top="5%",
                                  pos_right='30%'),
        xaxis_opts=opts.AxisOpts(name="Year"),
        yaxis_opts=opts.AxisOpts(name="Value"),
        legend_opts=opts.LegendOpts(pos_right=True, orient='vertical'),

    )

line_chart.render_notebook()
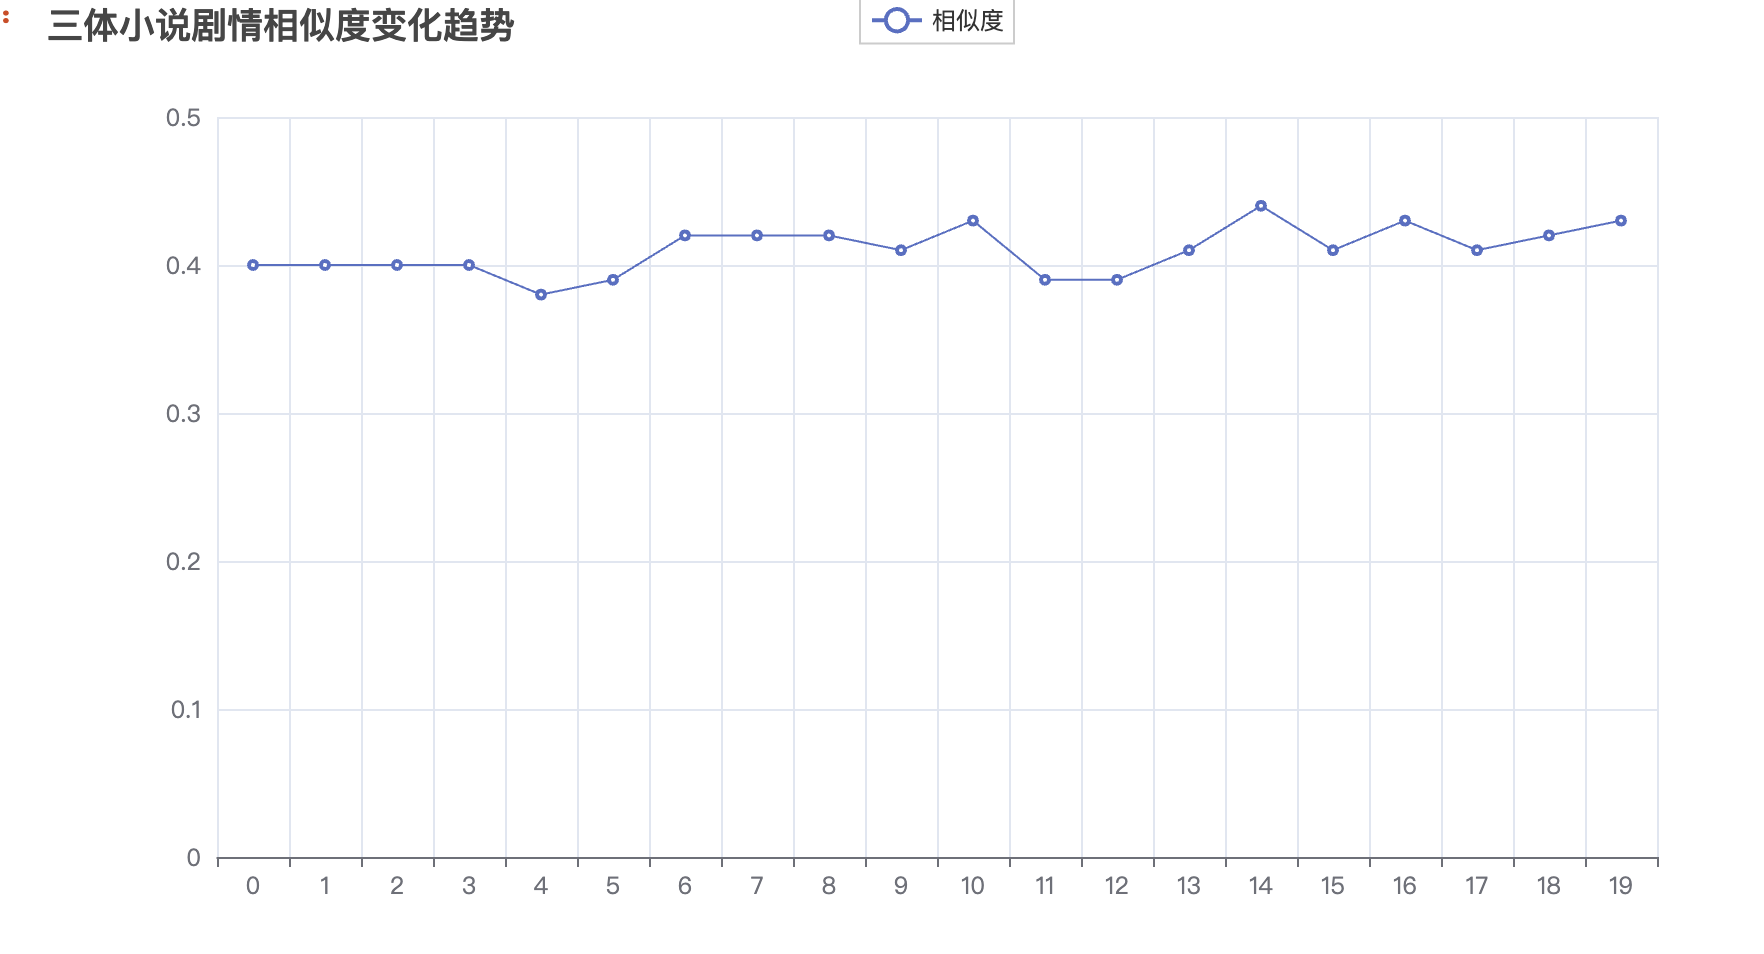
3.4 相似度可视化
剧情变化程度,使用cosine相似度度量。
from pyecharts.charts import Line
from pyecharts import options as opts
from pyecharts.globals import CurrentConfig, NotebookType
CurrentConfig.NOTEBOOK_TYPE = NotebookType.JUPYTER_NOTEBOOK
import cntext as ct

sims = []
for idx in range(len(df)):
    try:
        pre_text = df.loc[idx-1, 'doc']
        after_text = df.loc[idx, 'doc']
        sim = ct.cosine_sim(text1=pre_text, text2=after_text)
        sims.append(sim)
    except:
        sims.append(0.4)


line = Line()
line.add_xaxis(xaxis_data=list(range(20)))
line.add_yaxis("相似度",
               sims,
               label_opts=opts.LabelOpts(is_show=False))

line.set_global_opts(title_opts=opts.TitleOpts(title="三体小说剧情相似度变化趋势"))

line.load_javascript()
line.render('三体小说剧情相似度变化趋势.html')
line.render_notebook()
有了相似度变化序列数据, 可以使用 ruptures库, 找到序列变化的时间点(大致的章节位置), 可以参考 使用 Ruptures 识别时间序列数据中的变化点