
今天逛B站,看到《三体》三部曲全部人物关系数据可视化视频
于是动手写了今天的技术文。绘制人物网络关系图,需要有
- 节点数据; 节点名、节点属性
- 边数据; source、target、weight
- 可视化工具(Gephi软件或Python的可视化包)
本文代码
节点-人物数据
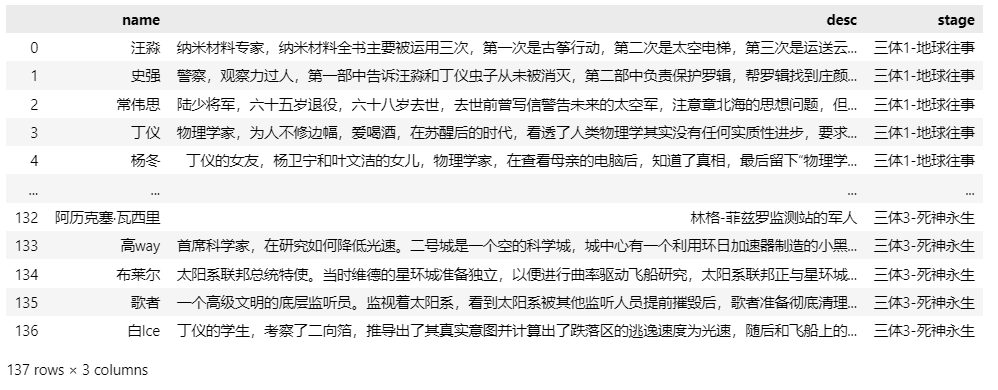
绘制人物关系网络图,首先需要有网络节点数据
- name 人物名称
- desc 人物简介
- stage 人物出现在三体小说的哪个阶段
import pandas as pd

nodes_info_df = pd.read_excel('data/三体人物.xlsx')
nodes_info_df
Run
边-人物关系数据
将节点数据依次在三体小说文本中按行进行检索,如果每行同时出现两个人物,两个人物会构建一个边。人物关系网络图可以用gephi软件进行绘制, 绘制需要两个csv文件,即
- 三体_nodes.csv
- 三体_edges.csv
实现代码如下
import jieba
import codecs
import csv

for name in df['name'].tolist():
    jieba.add_word(name)

nodes = {}			# 姓名字典,保存人物,该字典的键为人物名称,值为该人物在全文中出现的次数
relationships = {}	# 关系字典,保存人物关系的有向边,该字典的键为有向边的起点,值为一个字典edge,edge的键是有向边的终点,值是有向边的权值,代表两个人物之间联系的紧密程度
lineNodes = []		# 每段内人物关系,是一个缓存变量,保存对每一段分词得到当前段中出现的人物名称,lineName[i]是一个列表,列表中存储第i段中出现过的人物


with open("data/三体.txt", "r", encoding="utf-8") as f:
	for line in f.readlines():
		words = jieba.lcut(line)		# 分词并返回该词词性
		lineNodes.append([])		# 为新读入的一段添加人物名称列表
		for word in words:
			if word in df['name'].tolist():
				lineNodes[-1].append(word)		# 为当前段的环境增加一个人物
				if nodes.get(word) is None:
					nodes[word] = 0
				relationships[word] = {}
				nodes[word] += 1					# 该人物出现次数加 1


# explore relationships   对于 lineNames 中每一行,我们为该行中出现的所有人物两两相连。如果两个人物之间尚未有边建立,则将新建的边权值设为 1,否则将已存在的边的权值加 1。这种方法将产生很多的冗余边,这些冗余边将在最后处理。
for line in lineNodes:					# 对于每一段
	for node1 in line:
		for node2 in line:				# 每段中的任意两个人
			if node1 == node2:
				continue
			if relationships[node1].get(node2) is None:		# 若两人尚未同时出现则新建项
				relationships[node1][node2]= 1
			else:
				relationships[node1][node2] = relationships[node1][node2]+ 1		# 两人共同出现次数加 1


# output   将已经建好的 names 和 relationships 输出到文本,以方便 gephi 可视化处理。输出边的过程中可以过滤可能是冗余的边,这里假设共同出现次数少于 3 次的是冗余边,则在输出时跳过这样的边。输出的节点集合保存为 busan_node.txt ,边集合保存为 busan_edge.node 。
with open("output/三体_nodes.csv", "w", encoding="utf-8") as csvf1:
	writer1 = csv.DictWriter(csvf1, fieldnames=['id', 'label', 'weight'])
	writer1.writeheader()
	for node, times in nodes.items():
		line = {'id': node, 'label': node, 'weight': times}
		writer1.writerow(line)


with open("output/三体_edges.csv", "w", encoding="utf-8") as csvf2:
	writer2 = csv.DictWriter(csvf2, fieldnames=['source', 'target', 'weight'])
	writer2.writeheader()
	for node, edges in relationships.items():
		for target, weight in edges.items():
			if weight>3:
				line = {'source': node, 'target':target, 'weight':w}
				writer2.writerow(line)
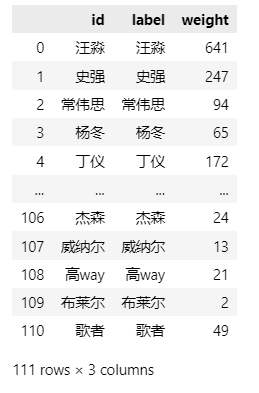
查看 三体_nodes.csv 文件样式
nodes_df = pd.read_csv('output/三体_nodes.csv', encoding='utf-8')
nodes_df
Run

查看 三体_edges.csv 文件样式
edges_df = pd.read_csv('output/三体_edges.csv', encoding='utf-8')
edges_df
Run
绘制关系图
本文不讲解gephi,感兴趣的可以去B站搜gephi使用方法。 实现可视化,除了gephi, 也可以使用pyechart库实现不错的可视化效果。
import numpy as np
from pyecharts import options as opts
from pyecharts.charts import Graph
from pyecharts.globals import CurrentConfig, NotebookType
CurrentConfig.NOTEBOOK_TYPE = NotebookType.JUPYTER_NOTEBOOK


nodes_data = []
edges_data = []
categories_data = []

for node, weight in zip(nodes_df.label, nodes_df.weight):
    category = nodes_info_df[nodes_info_df['name']==node]['stage'].values[0]
    ##使用weight作为圆点的值,除以10,防止圆点太大占满整个屏幕.
    node_info = {"name": str(node), "symbolSize": weight/10, 'category': category, "value": weight/10}
    nodes_data.append(node_info)

for ix, source, target in zip(edges_df.index, edges_df.source, edges_df.target):
    edges_data.append({"id": ix, "source": source, "target": target})

for category in set(df['stage'].tolist()):
    categories_data.append({'name': category})


c = (
    Graph(init_opts=opts.InitOpts(width="1000px", height="600px"))
    .add(
        "",
        nodes=nodes_data,
        links=edges_data,
        categories=categories_data,
        layout="circular",
        is_rotate_label=True,
        linestyle_opts=opts.LineStyleOpts(color="source", curve=0.3),
        label_opts=opts.LabelOpts(position="right"),
    )
    .set_global_opts(
        title_opts=opts.TitleOpts(title="三体人物关系图"),
        legend_opts=opts.LegendOpts(orient="vertical", pos_left="2%", pos_top="20%"),
    )
)

c.render('output/三体_graph.html')
c.render_notebook()
Run