今天分享一个R语言ggsci包,帮你绘制出美观舒服,又合期刊编辑审美风格的图表。
安装
install.packages("ggsci")
#remotes::install_github("nanxstats/ggsci")
使用 vignette("ggsci")可以查看ggsci的vignette。
期刊风格
ggsci支持的主题风格主要参考自期刊、可视化库
| 风格 | 期刊、技术框架 |
|---|---|
| NPG | Nature旗下期刊(Nature Publishing Group) |
| AAAS | Science旗下期刊() |
| NEJM | 新英格兰医学杂志(New England Journal of Medicine) |
| Lancet | 柳叶刀杂志(Lancet Oncology) |
| JAMA | 美国医学学会杂志(Journal of the American Medical Association) |
| JCO | 临床肿瘤学杂志(Journal of Clinical Oncology) |
| UCSCGB | UCSC基因组浏览器(UCSC Genome Browser) |
| D3 | d3.js |
| … | … |
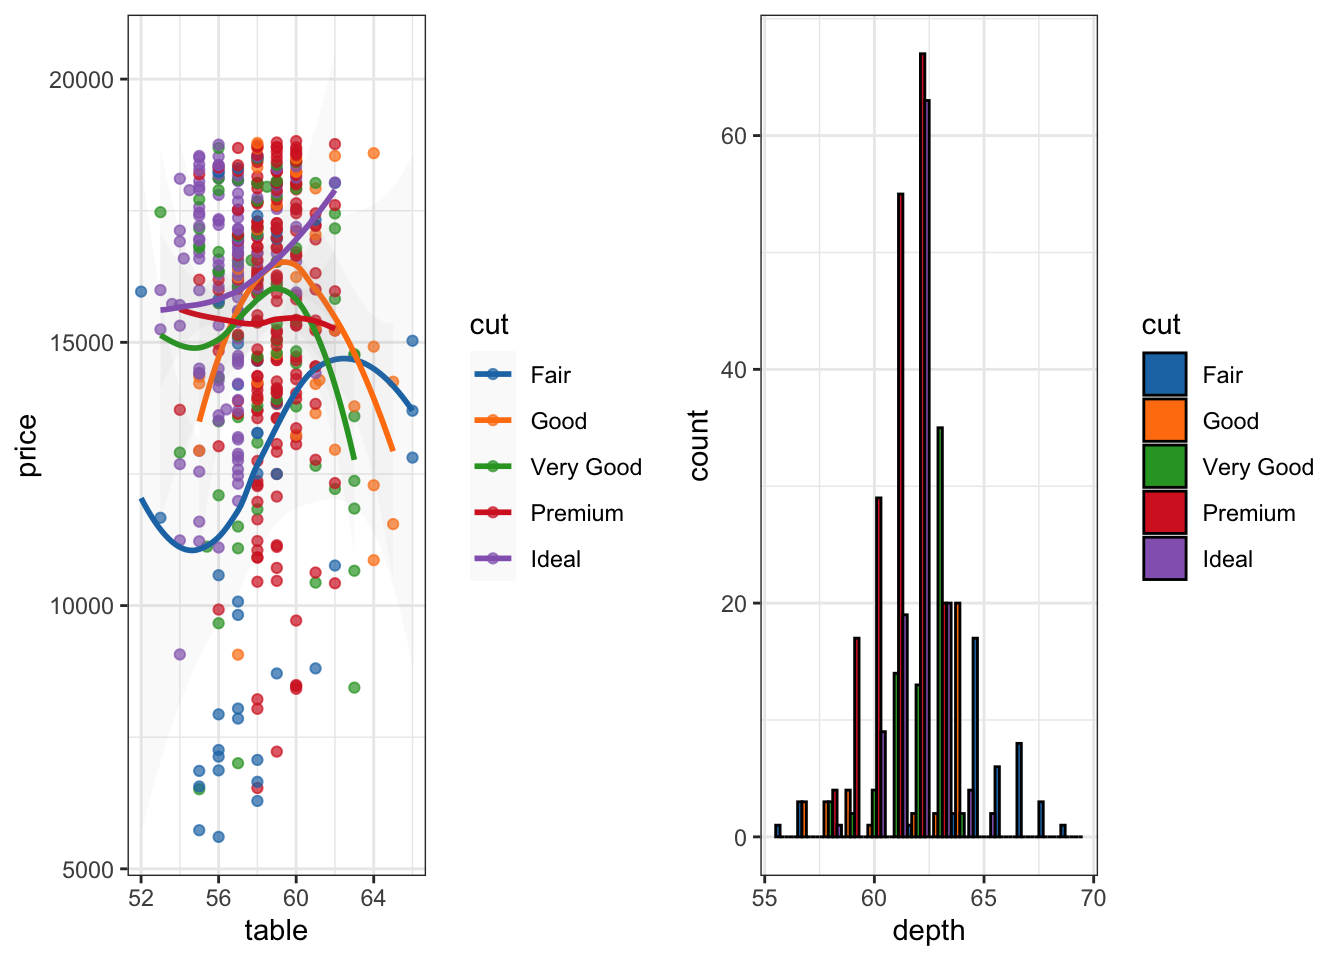
基本图表
这里准备一个常见的ggplot2图表
library("ggsci")
library("ggplot2")
library("gridExtra")

data("diamonds")

p1 = ggplot(subset(diamonds, carat >= 2.2),
       aes(x = table, y = price, colour = cut)) +
  geom_point(alpha = 0.7) +
  geom_smooth(method = "loess", alpha = 0.05, size = 1, span = 1) +
  theme_bw()

p2 = ggplot(subset(diamonds, carat > 2.2 & depth > 55 & depth < 70),
       aes(x = depth, fill = cut)) +
  geom_histogram(colour = "black", binwidth = 1, position = "dodge") +
  theme_bw()

grid.arrange(p1, p2, ncol=2)
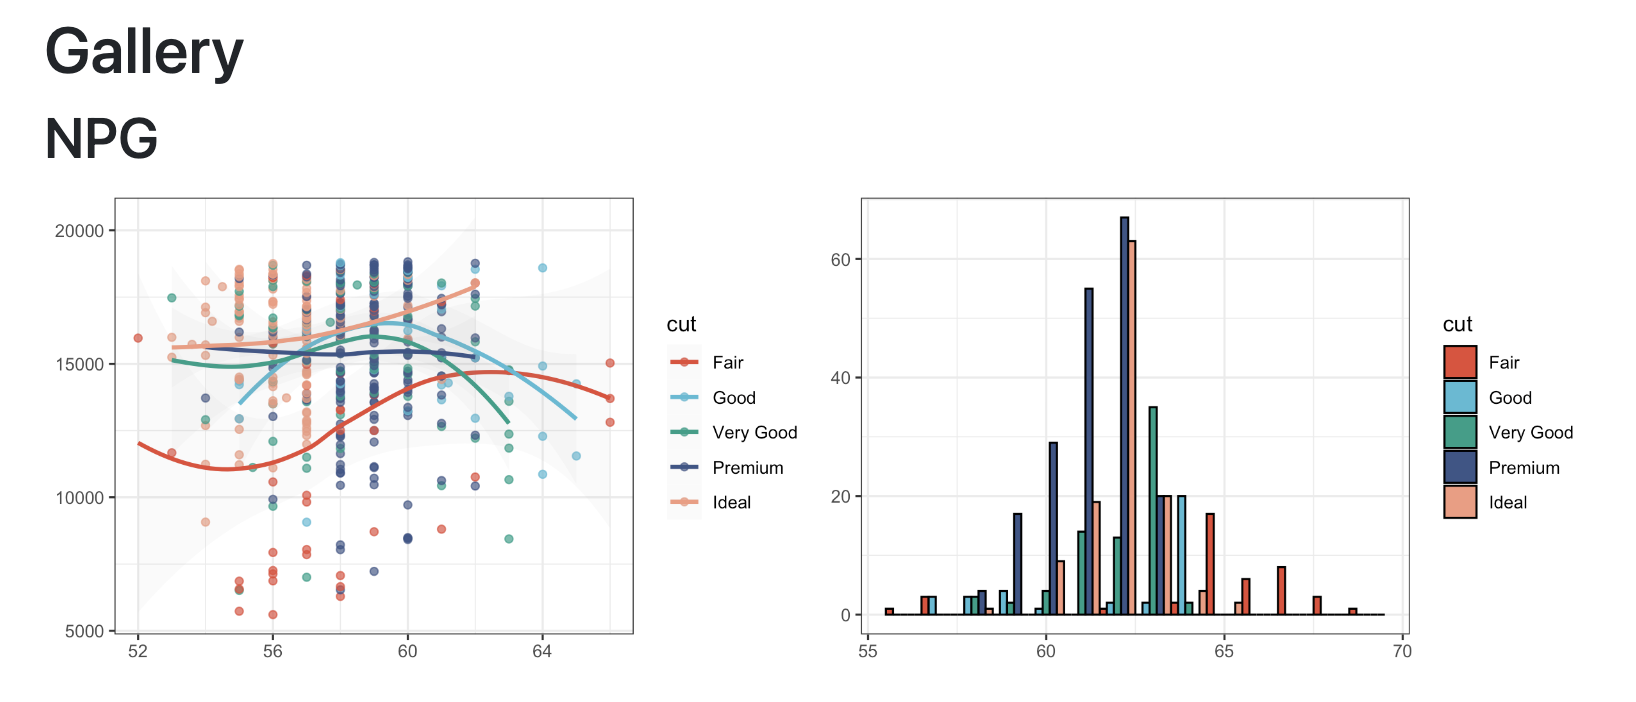
Gallery
NPG
ature旗下期刊(Nature Publishing Group)配色风格
p1_npg = p1 + scale_color_npg()
p2_npg = p2 + scale_fill_npg()
grid.arrange(p1_npg, p2_npg, ncol = 2)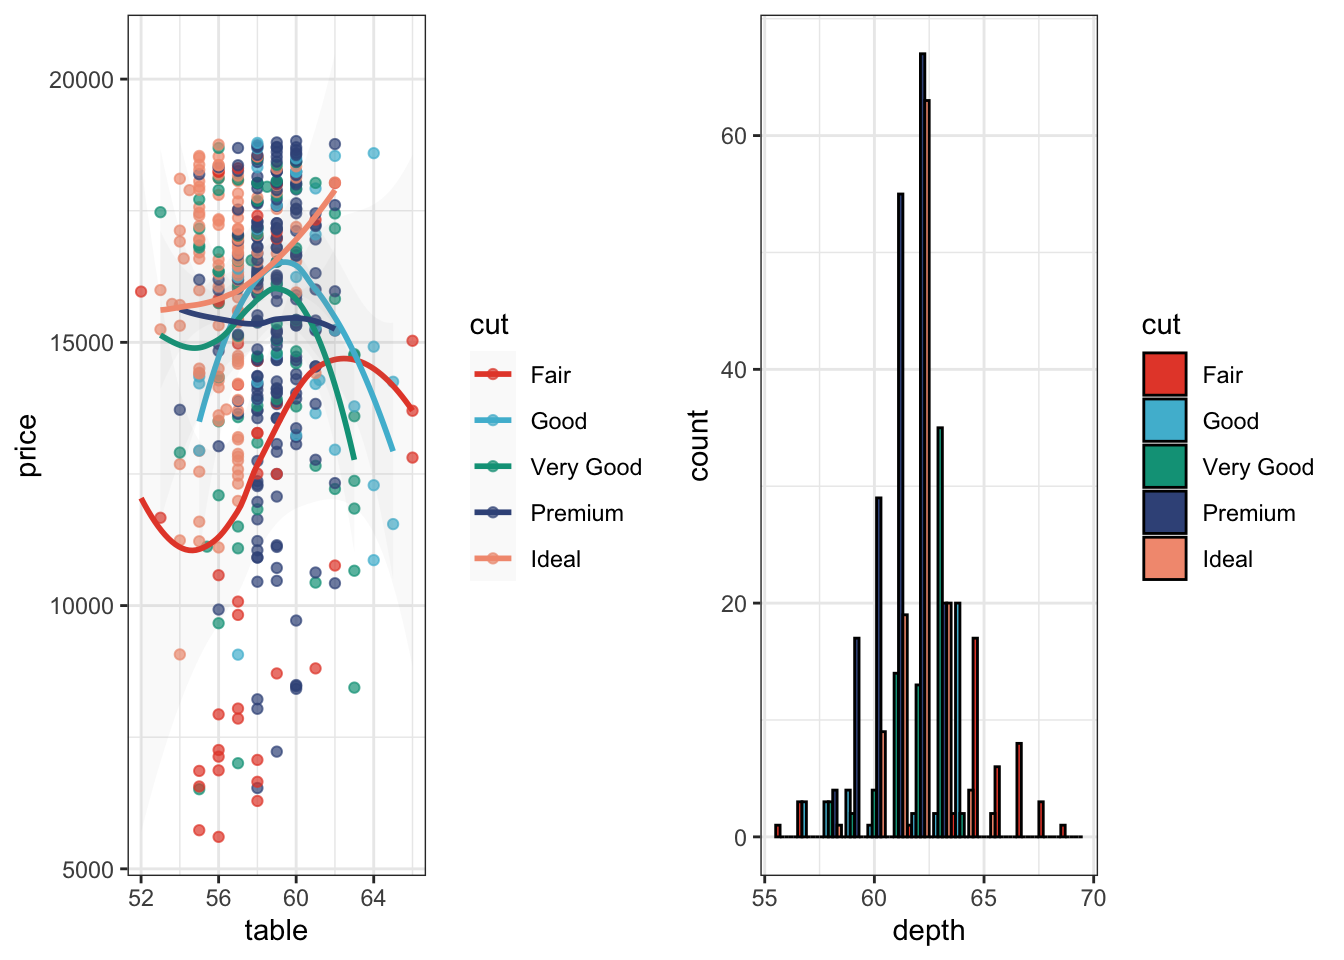
AAAS
Science旗下期刊(American Association for the Advancement of Science)配色风格
p1_aaas = p1 + scale_color_aaas()
p2_aaas = p2 + scale_fill_aaas()
grid.arrange(p1_aaas, p2_aaas, ncol = 2)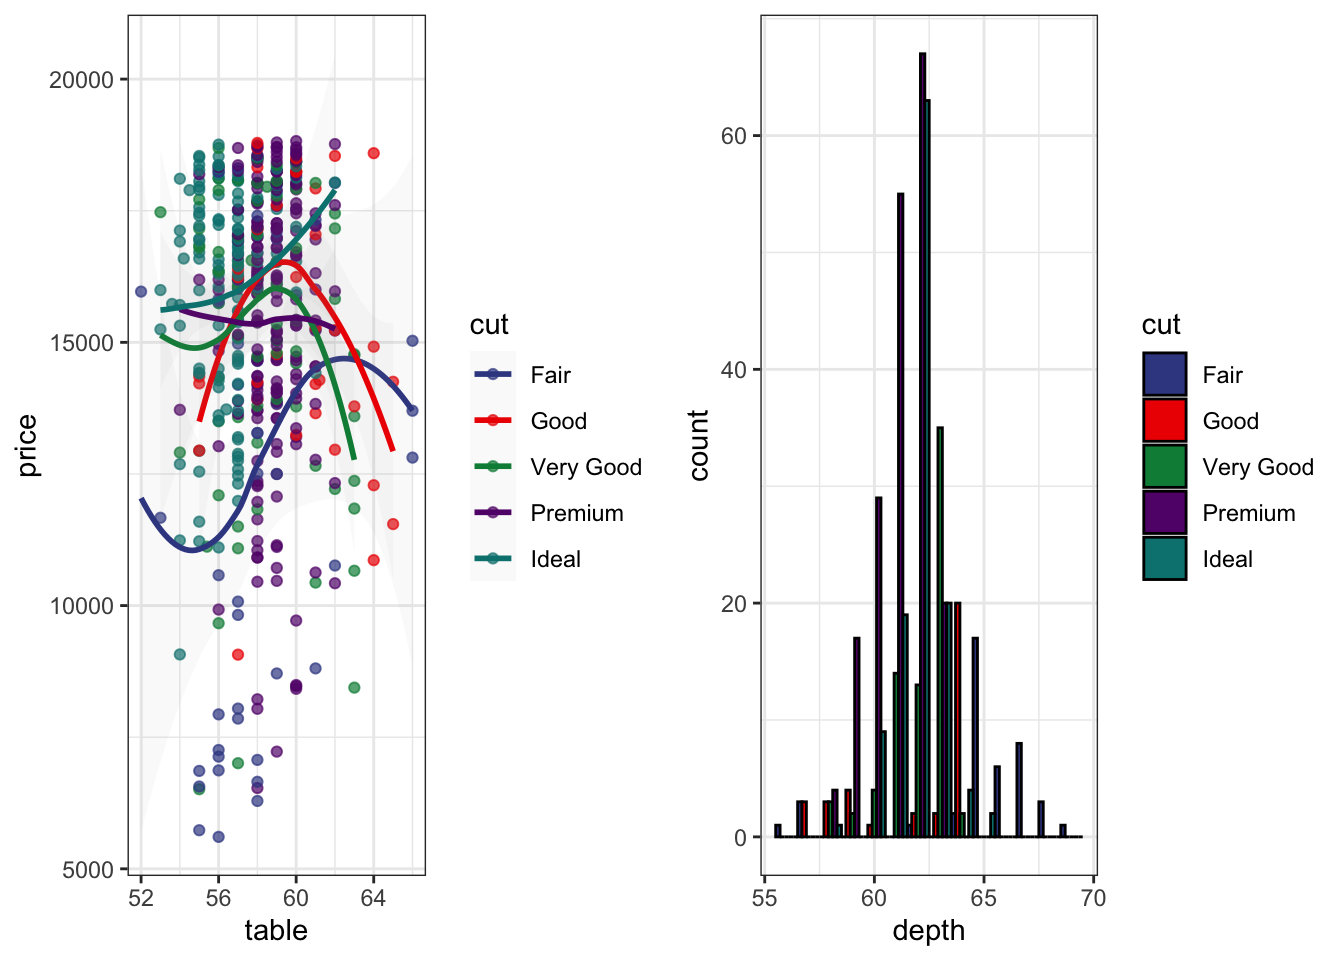
NEJM
新英格兰医学杂志(New England Journal of Medicine)配色风格
p1_nejm = p1 + scale_color_nejm()
p2_nejm = p2 + scale_fill_nejm()
grid.arrange(p1_nejm, p2_nejm, ncol = 2)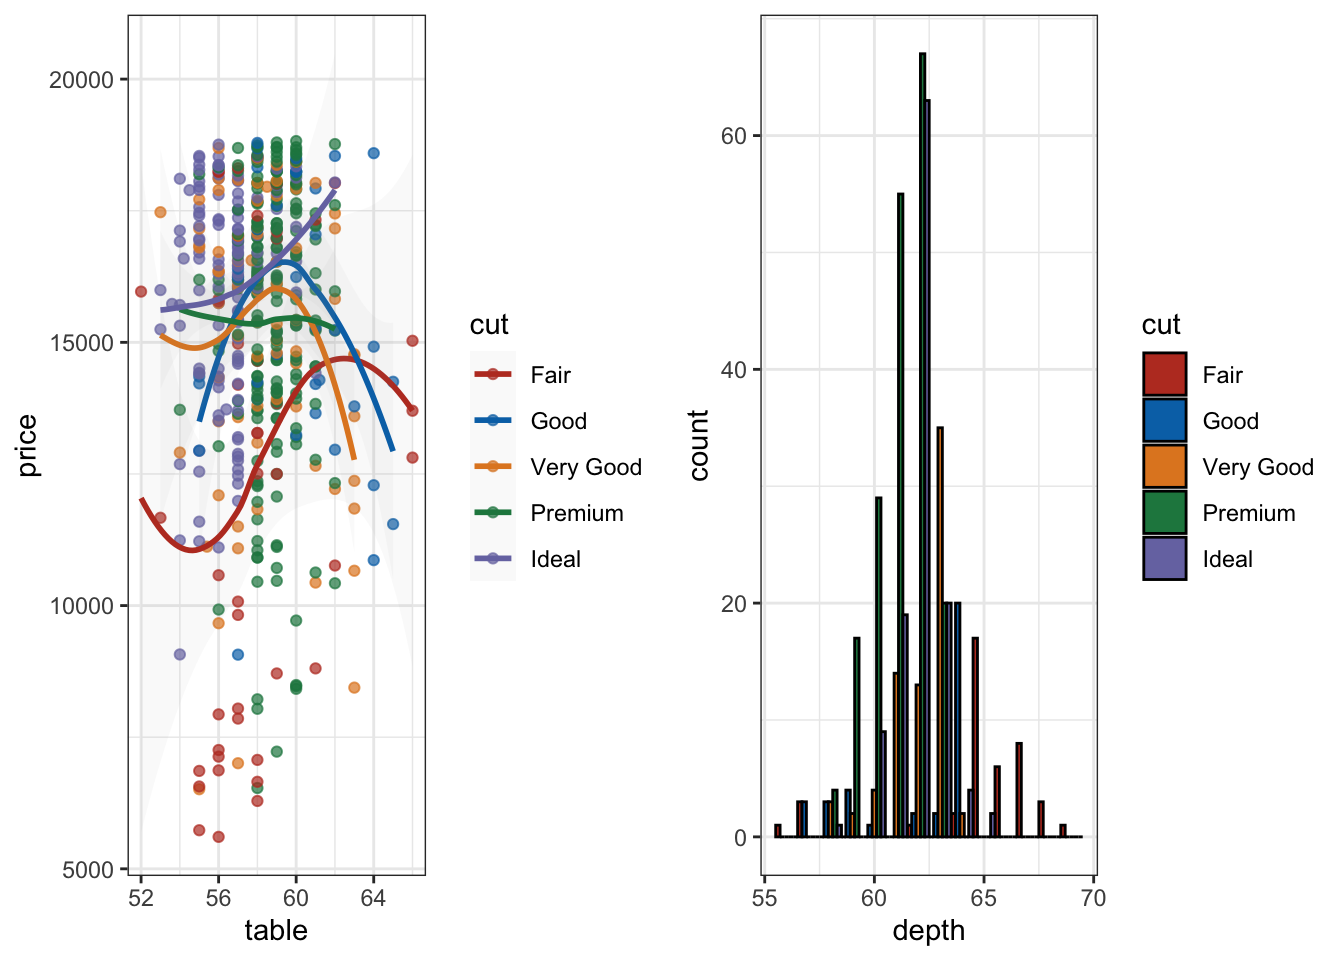
Lancet
柳叶刀杂(Lancet)志配色风格
p1_lancet = p1 + scale_color_lancet()
p2_lancet = p2 + scale_fill_lancet()
grid.arrange(p1_lancet, p2_lancet, ncol = 2)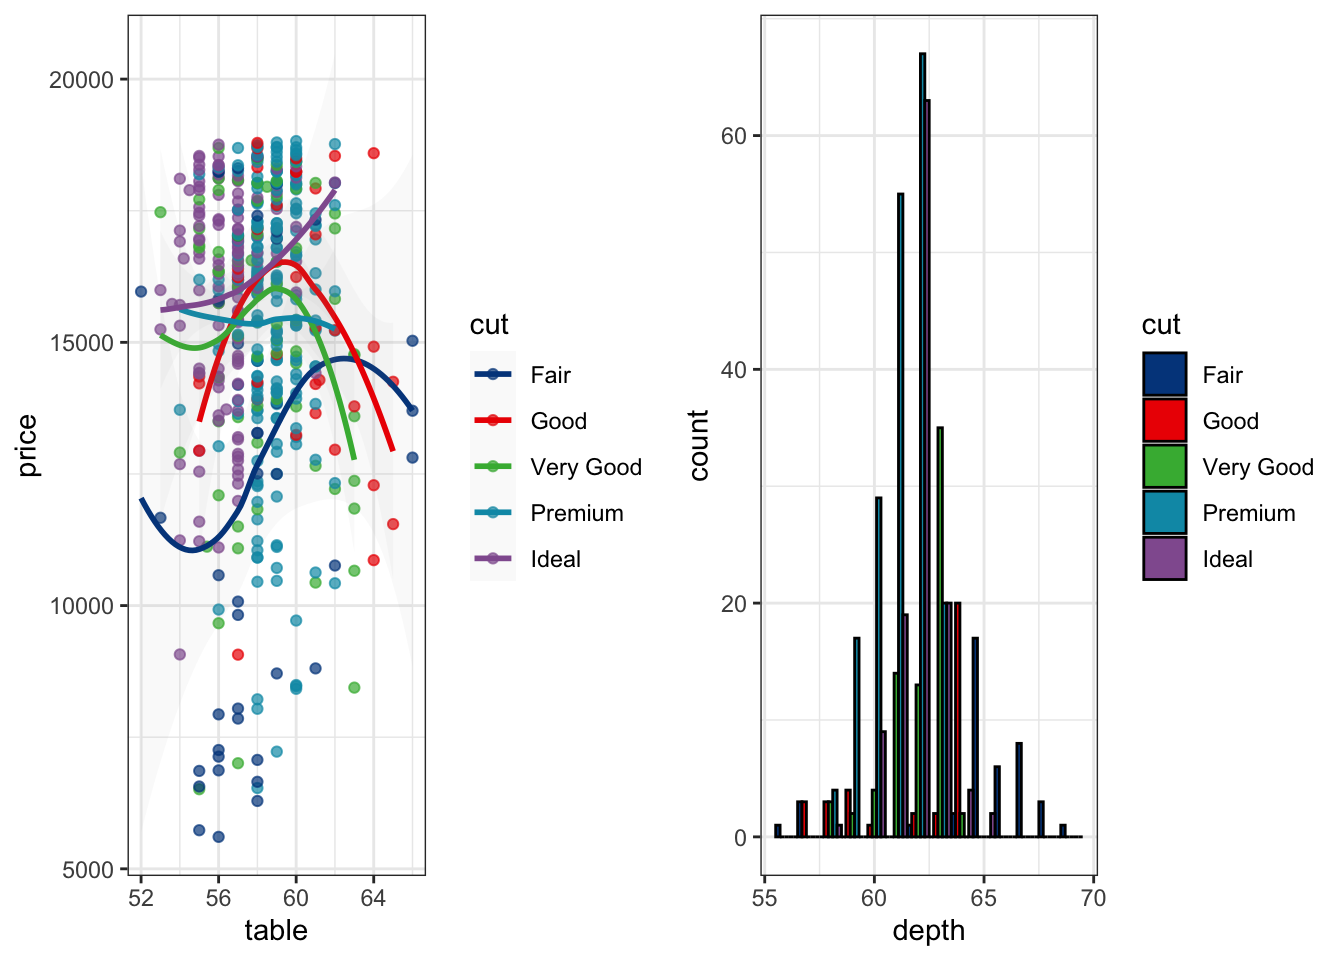
JAMA
美国医学学会杂志(Journal of the American Medical Association)配色风格
p1_jama = p1 + scale_color_jama()
p2_jama = p2 + scale_fill_jama()
grid.arrange(p1_jama, p2_jama, ncol = 2)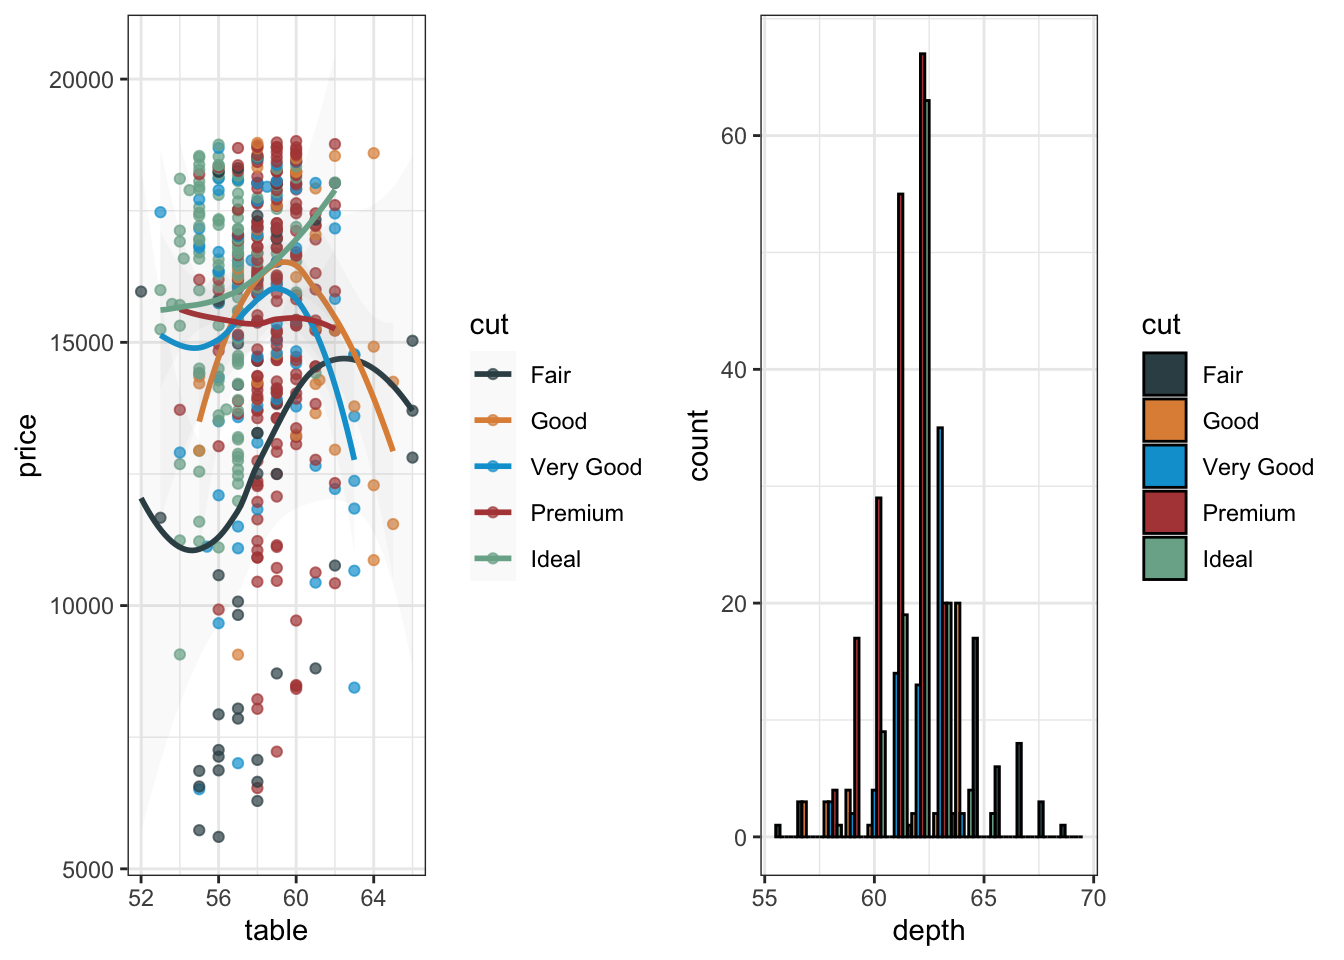
JCO
临床肿瘤学杂志(Journal of Clinical Oncology)配色风格
p1_jco = p1 + scale_color_jco()
p2_jco = p2 + scale_fill_jco()
grid.arrange(p1_jco, p2_jco, ncol = 2)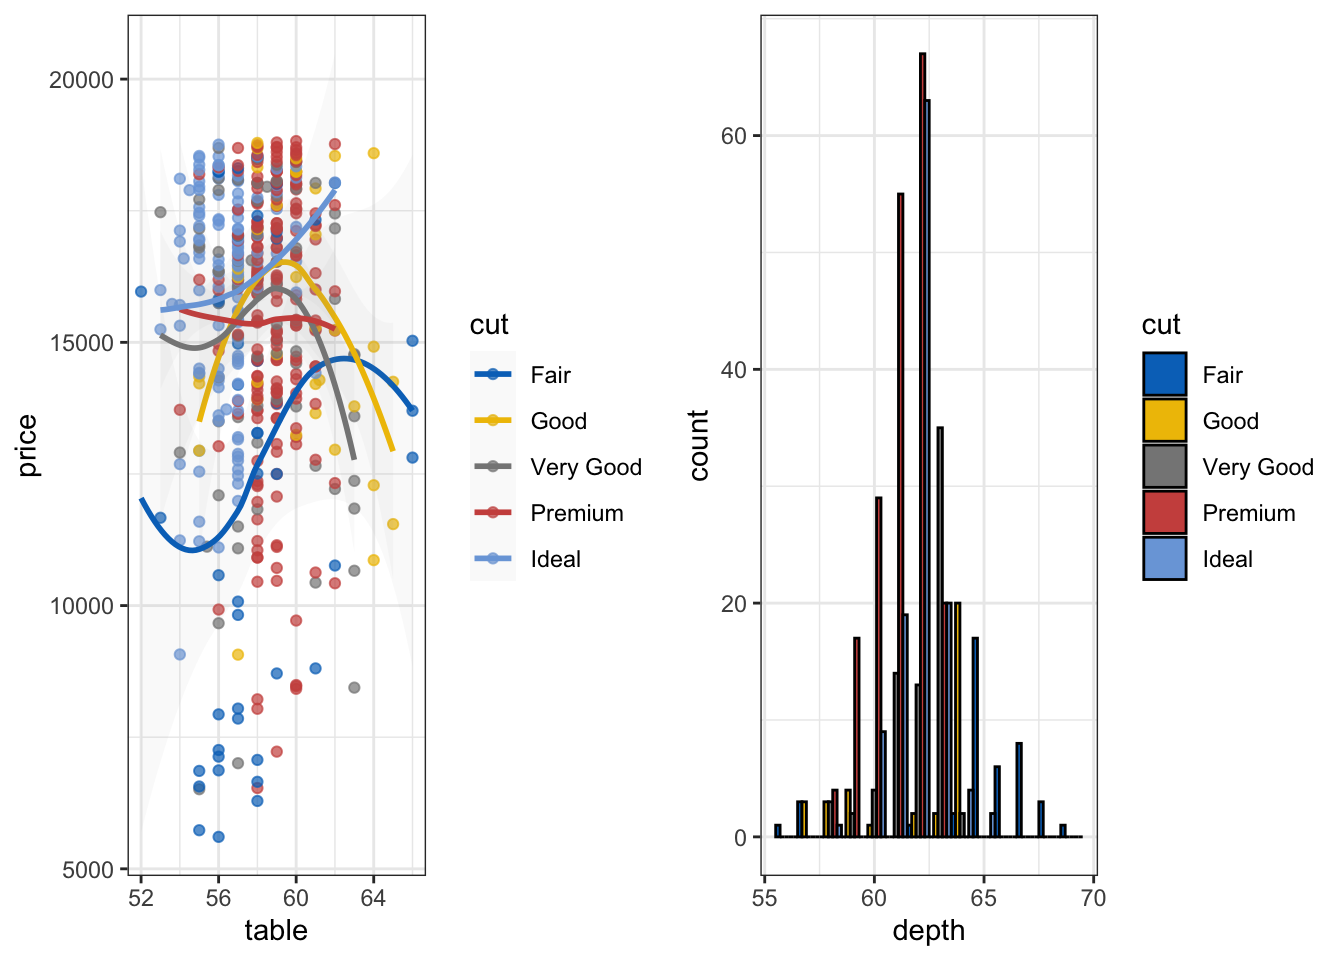
D3
d3.js配色风格
p1_d3 = p1 + scale_color_d3()
p2_d3 = p2 + scale_fill_d3()
grid.arrange(p1_d3, p2_d3, ncol = 2)